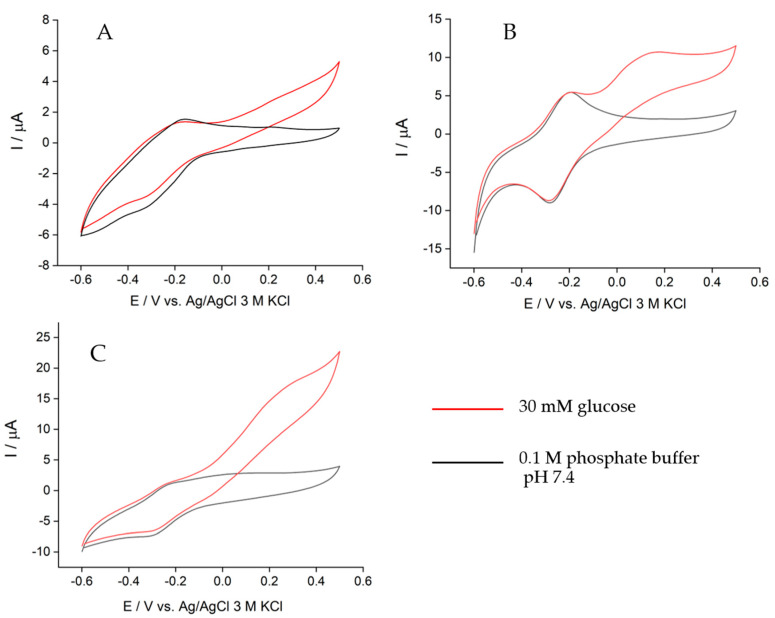
Figure 2.
Cyclic voltammograms of the bioanode with different modifications: (A) GDH/poly(TBO)/GCE, (B) GDH/poly(TBO)/GO/GCE, and (C) GDH/poly(TBO)/rGO/GCE in the presence of 0.1 M phosphate buffer pH 7.4 containing 5 mM NAD+ and 30 mM glucose (red) and the absence of glucose (black) at a scan rate of 10 mV/s, air-saturating conditions.

