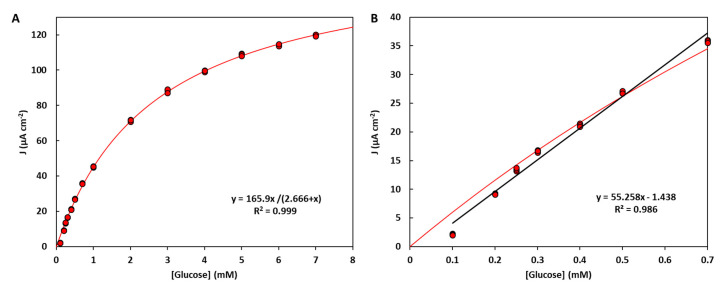
Figure 6.
Calibration curve for the self-powered detection of glucose (n = 3) in a membrane-less cell configuration, using the optimized electrodes and a 10 kΩ resistor setting. The calibration curve can be well described using a Michaelis–Menten law and used across a broad glucose concentration range (A), with parameters Jmax = (165.9 ± 1.6) µA cm−2, Km = (2.67 ± 0.06) mM. A conventional linear calibration can also be used for selected ranges, such as the low concentrations shown in panel (B).

