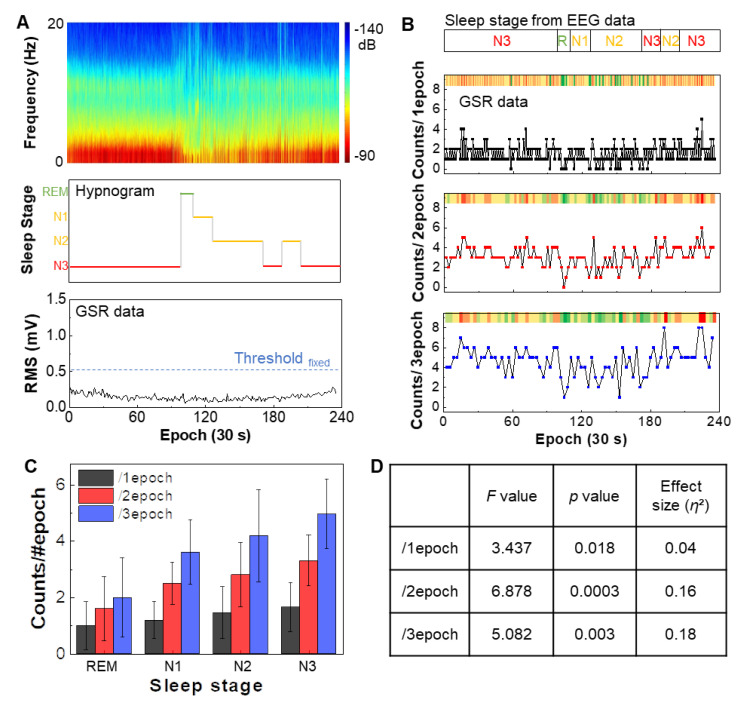
Figure 4.
Determination of four sleep stages based on GSR data. (A) Raw EEG spectrogram measured during sleep (top), hypnogram derived from the EEG data showing four sleep stages, including REM, N1, N2, and N3 (middle), and measured GSR data during sleep (bottom). The RMS values from GSR data show a continuous low tendency below the fixed threshold, verifying the entire epochs are in sleep status. (B) Comparison of classified sleep stages from EEG data with GSR data in three epochs. (C) Summarized correlation between sleep stages and GSR counts from three epochs in (B). Error bars: standard deviation from three trials. (D) Summary of statistical analysis using ANOVA, showing the data significance in (C). High significance is identified in epoch 2 (F = 6.878, p = 0.0003, η2 = 0.16).

