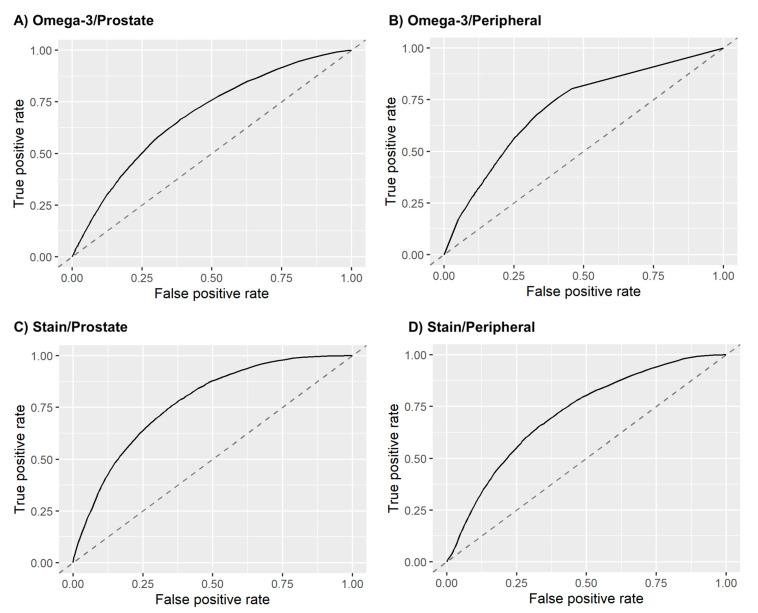
Figure 4.
Average ROC curves of the radiomics model for (A) omega-3 usage prediction based on prostate ROI, (B) omega-3 usage prediction based on peripheral ROI, (C) statin usage prediction based on prostate ROI, and (D) statin usage prediction based on peripheral ROI. The ROC curves are averaged from the 1500 validation test sets.

