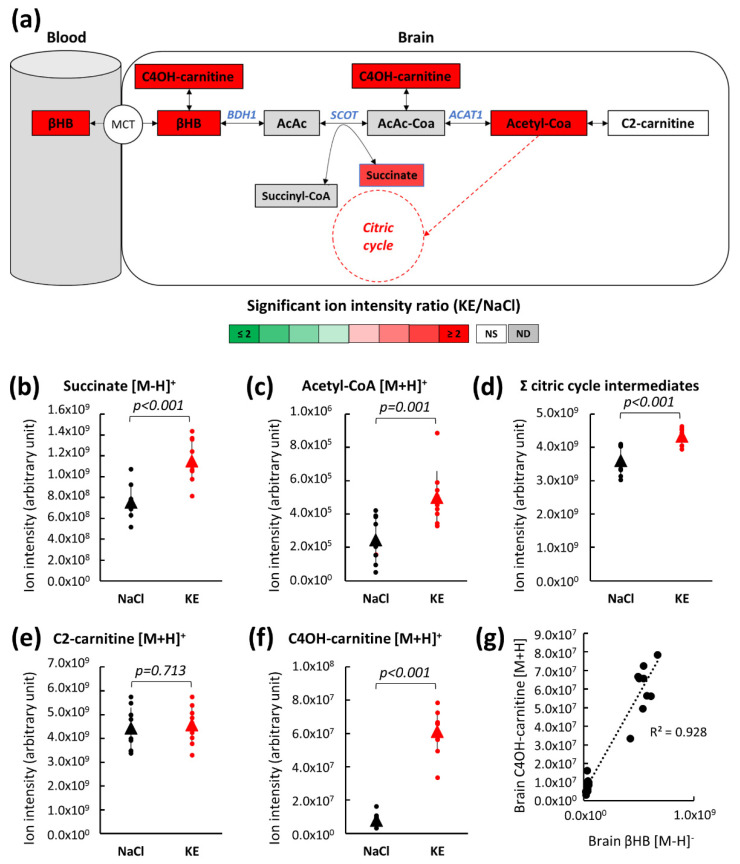
Figure 5.
Brain metabolite levels of the βHB pathway after KE ingestion. Schematic representation of the brain βHB pathway indicating significant metabolic changes for the relevant intermediates by color code. Brain metabolite levels were assessed by LC-MS 30 min after the ingestion of KE (3 mg KE/g of body weight) or 0.9% NaCl (a). Individual LC-MS analysis of succinate (b), acetyl-CoA (c), total citric acid cycle intermediates (d), C2-carnitine (e), and C4OH-carnitine (f). Correlation between βHB and C4OH-carnitine in brain 30 min after the ingestion of KE (n = 10) (g). (ND: not detected; NS: not significant; MCT: monocarboxylate transporters; C4OH-carnitine: hydroxybutyrylcarnitine; AcAc: acetoacetate; AcAc-CoA: acetoacetyl-CoA; C2-carnitine: acetyl-carnitine; BDH1: β-hydroxybutyrate dehydrogenase 1; SCOT: succinyl-CoA:3-ketoacid CoA transferase; ACAT1: acetyl-CoA acetyltransferase or acetyl-CoA thiolase).

