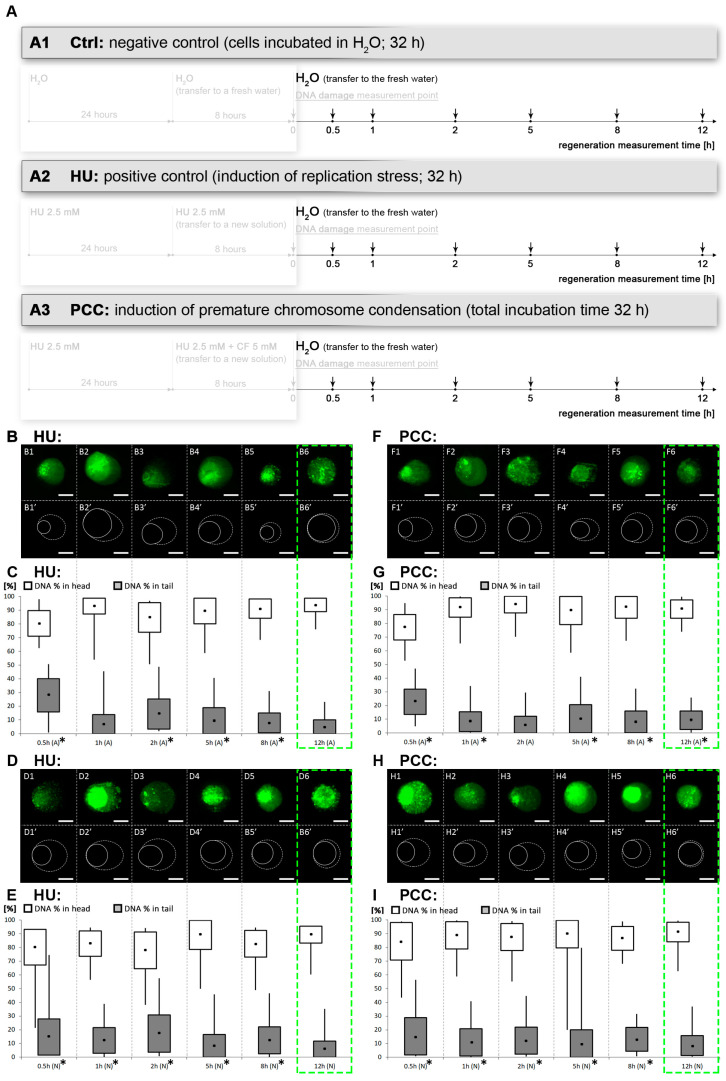
Figure 4.
The dynamics of DNA damage repair. (A) The diagram depicting the regeneration period and measurement times. After the 32-h incubation, all the cells were released into distilled water, the DNA damage levels were assessed and used as the reference for further measurements. The arrows pointing down show the times of the measurements. (B,C) Alkaline comet assay for the positive control (HU), (D,E) neutral comet assay for the HU. (F,G) Alkaline comet assay and (H,I) neutral comet assay for the PCC. The drawings marked as B1′–B6′, D1′–D6′, F1′–F6′ and H1′–H6′ are based on the microscope images above; the solid line depicts the comet’s head, the dashed line depicts the comet’s tail. The green, dashed frame marks the estimated regeneration time. Both the HU and PCC series were statistically checked for differences against the negative control. The statistical significance was assessed for HU and PCC in comparison to the control at * p < 0.05 (ANOVA and Fisher’s LSD test). The scale bars are equal to 10 µm.

