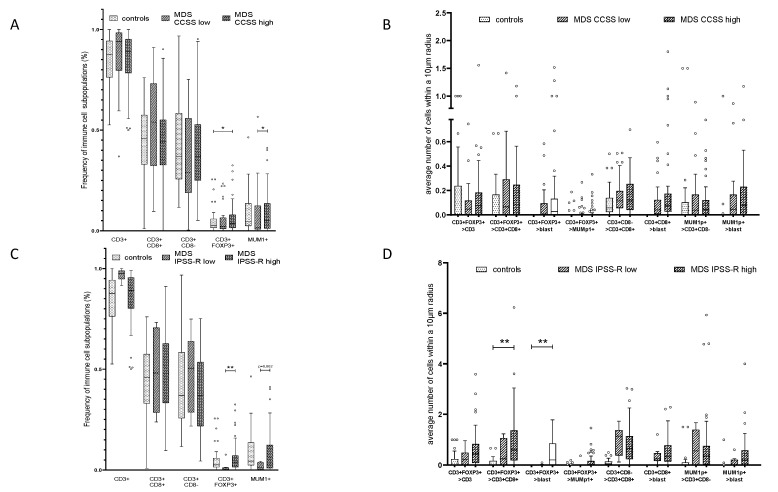
Figure 4.
Composition and frequency of the immune cell infiltrate and their spatial distribution to CD34+ blasts in MDS/sAML in association to the karyotype and the IPSS-R. (A) Correlation of MDS with CCSS low and high to the frequency of MUM1p+CD3− post–germinal center B cells/plasma cells, CD3+CD8+, CD3+CD8−, and CD3+FOXP3+ T cells, presented as number of immune cell subpopulations in % with a significant correlation of MUM1p+CD3− post–germinal center B cells/plasma cell frequency/CD3+FOXP3+ T cells and CCSS high. (B) Correlation of CCSS high versus CCSS low MDS specimen considering the average number of immune cell subpopulations within a radius of 10 µm around CD34+ blasts revealed no significant differences between the CCSS high versus CCSS low prognostic group. (C) Correlation of MDS with IPSS-R risk score low and high to the frequency of MUM1p+CD3− post-germinal center B cells/plasma cells, CD3+CD8+, CD3+CD8−, and CD3+FOXP3+ T cells, presented as number of immune cell subpopulations in % with a significant correlation of CD3+FOXP3+ T cells and slightly increased numbers of MUM1p+CD3− B/plasma cells in IPSS-R high risk cases. (D) Spatial analysis data for IPSS-R high versus IPSS-R low in untreated MDS specimen considering average number of immune cell subpopulations within a radius of 10 µm revealed no significant differences. Statistically significant relations are marked with asterisks (* p < 0.05; ** p <0.005, *** p < 0.0005).

