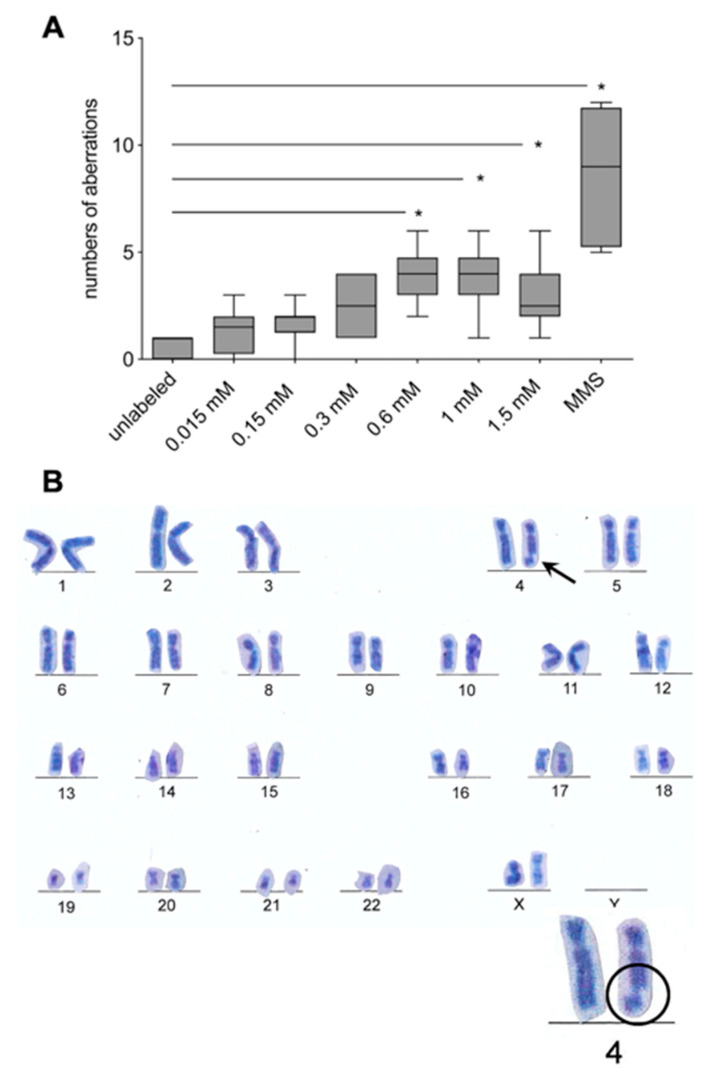
Figure 4.
Chromosomal aberration test: (A) There was a significant increase in chromosomal aberrations from a concentration of 0.6 mM onwards compared to the unlabeled control (* p < 0.001: 0.6 mM, 1 mM; * p < 0.05: 1.5 mM). Furthermore, there was a significant increase in chromosomal aberrations after exposure of the hASCs to 200 µM MMS (positive control, * p < 0.0001). Significance is indicated by asterisks. (B) Chromatid and chromosomal breaks were observed: the example shows a chromatid break of chromosome 4.

