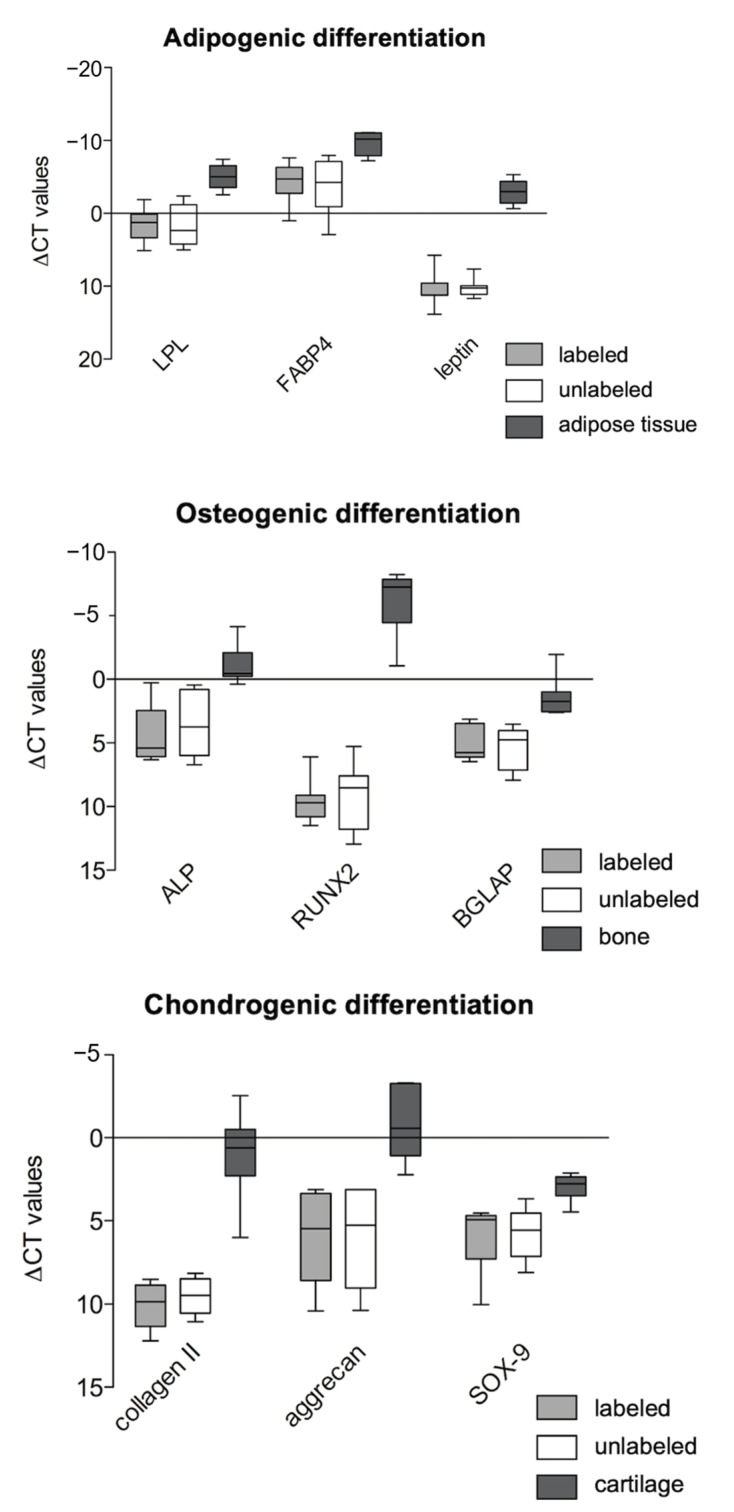
Figure 9.
Real time-PCR analyses after adipogenic, osteogenic and chondrogenic differentiation: The presented values (∆CT values) are normalized to the gene expression values of GAPDH. No differences in the expression of specific marker genes after adipogenic, osteogenic and chondrogenic induction between labeled and unlabeled hASCs were detected. Native tissues such as adipose tissue, bone and cartilage were used as positive controls.

