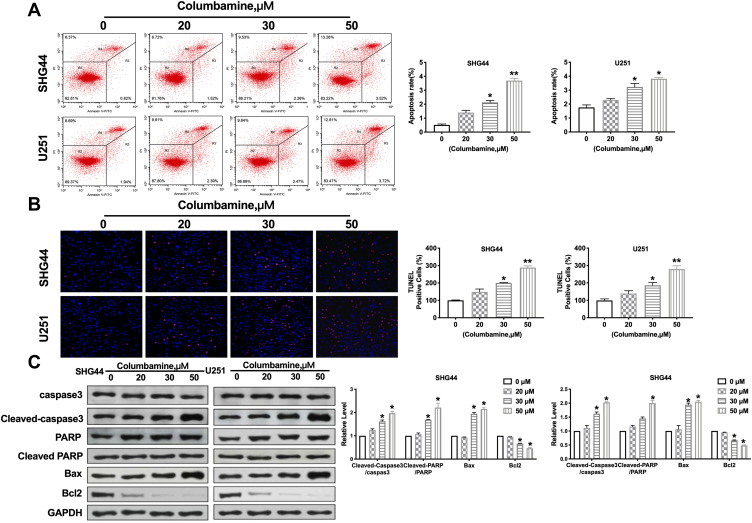
Figure 3.
Apoptosis of glioma cells induced by Columbamine. (A) Flow cytometry was performed to quantify the apoptotic of glioma cells. n=4, *P<0.05 vs 0μM group, **P<0.01 vs 0μM group. (B) The TUNEL staining was performed on glioma cells after treatment with 0, 20 μM, 30 μM, and 50 μM Columbamine for 24 h. TUNEL-positive cells are shown. n=7, *P<0.05 vs 0μM group, **P<0.01 vs 0μM group. (C) The expression of apoptosis-associated proteins (Caspase3, Cleaved caspase3, PAPR, Cleaved PAPR, Bcl2, and Bax) was detected in glioma cells after columbamine treatment. n=6, *P<0.05 vs 0μM group.

