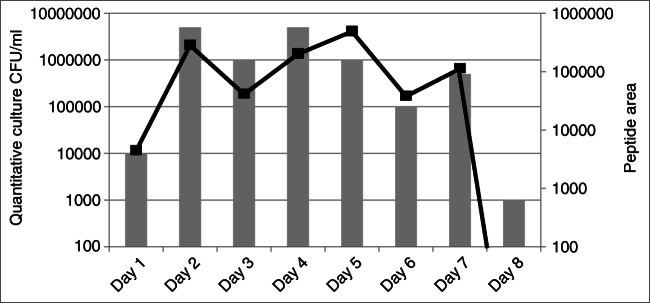
Fig. 4.
Patient monitoring by SRM and quantitative culture analysis. ETA samples from one patient, infected by E. coli, were obtained from day 1 to day 8. The semi-quantitative cultures are referred on the vertical left axis and represented by vertical bars. The integration area of a SRM chromatographic peak from an E. coli peptide is referred on the vertical right axis and represented by a black line

