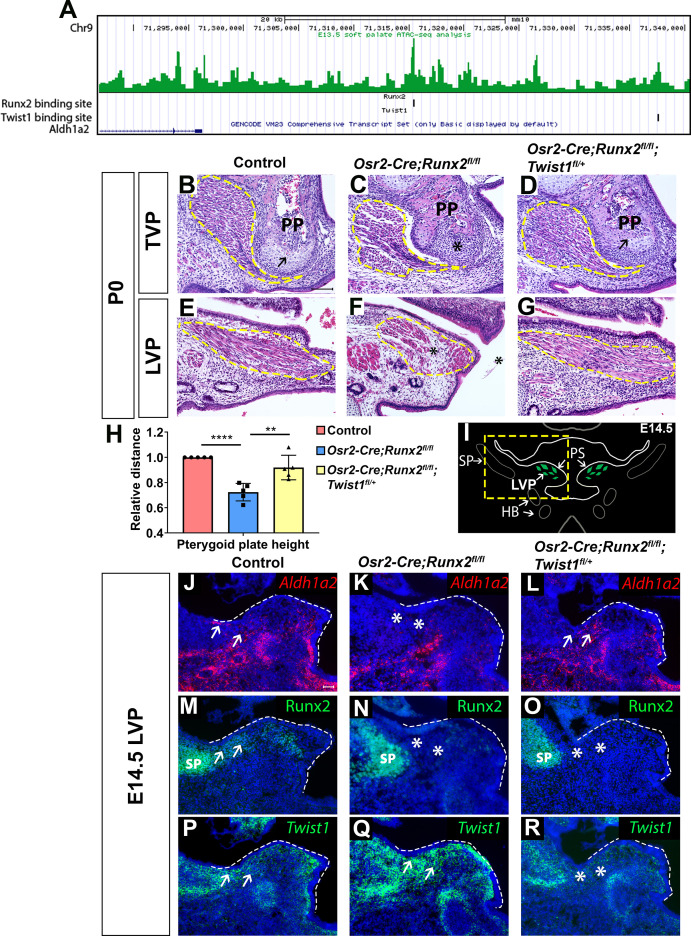
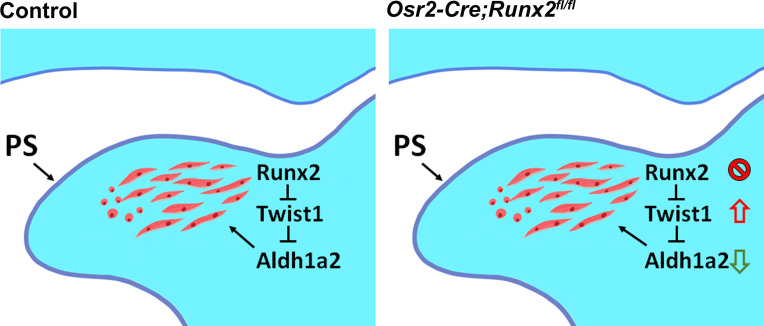
Figure 6. Twist1 antagonizes Runx2 to regulate soft palate development.
(A) ATAC-seq peaks showing Twist1- and Runx2-binding sites are present in the opened regulatory regions near the Aldh1a2 locus in the soft palate tissue. (B–G) H and E staining of tensor veli palatini (TVP) and levator veli palatini (LVP) coronal sections in P0 control, Osr2-Cre;Runx2fl/fl and Osr2-Cre;Runx2fl/fl;Twist1fl/+ mice (N = 5). Yellow dashed lines outline the location of myogenic cells. Arrows indicate comparable structures in the pterygoid plates (PP) of control and Osr2-Cre;Runx2fl/fl;Twist1fl/+ mice. Asterisk indicates defective pterygoid plate, palate and LVP muscles in Osr2-Cre;Runx2fl/fl. (H) Quantification of the height of the palatine bone from control (red bars), Osr2-Cre;Runx2fl/fl (blue bars) mice and Osr2-Cre;Runx2fl/fl;Twist1fl/+ (yellow bars) mice (N = 5). (I) Schematic drawings of Myod1 (green), styloid process of temporal bone (SP) and hyoid bone (HB) on coronal sections in the LVP region of E14.5 control mice. (J–R) Aldh1a2 RNAscope in situ hybridization (J–L), Runx2 immunostaining (M–O) and Twist1 RNAscope in situ hybridization (P–R) in E14.5 LVP coronal sections of control, Osr2-Cre;Runx2fl/fl and Osr2-Cre;Runx2fl/fl;Twist1fl/+ mice. White dashed lines outline the palatal shelf. Scale bars in B and J indicate 100 µm for B-G and J-R, respectively.


