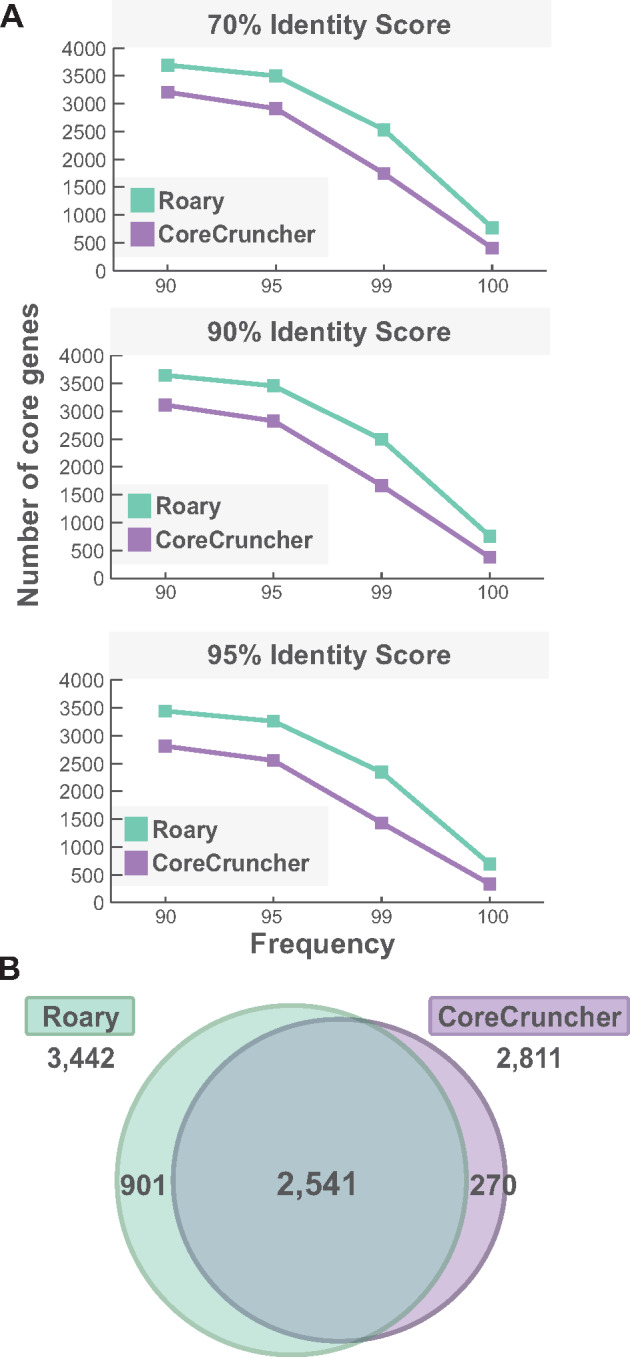
Fig. 3.

Comparison of the core genomes built by CoreCruncher and Roary across parameters. (A) Number of core genes inferred by CoreCruncher and Roary, respectively. Core genomes were built using a minimum sequence identity threshold of 70% (top), 90% (middle), and 95% (bottom). In each case, an orthologous gene family was considered as part of the core genome when present in at least 90%, 95%, 99%, or 100% of the genomes (x-axis). CoreCruncher was run using the nonstringent option and other parameters were set as default. (B) Comparison of the core genomes built by CoreCruncher and Roary using a minimum sequence identity threshold of 95% and a minimum genome frequency of 90%. Numbers indicate the number of core genes shared by both programs and specific to each program. Data for other parameters are presented supplementary table S2, Supplementary Material online.
