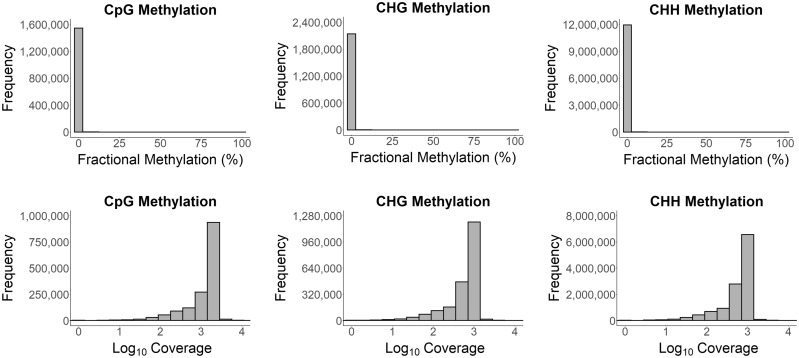
Fig. 3.
Cytosine methylation in Henneguya salminicola. Histograms of fractional methylation (ratio of the number of methylated reads to the total number of methylated and unmethylated reads) for the CpG, CHG, and CHH methylation contexts for the alignment of the deduplicated final filtered H. salminicola reads to the H. salminicola assembly (top row). Histograms of read coverage per base for three different methylation contexts for the alignment of the final filtered H. salminicola reads to the H. salminicola assembly (bottom row).

