Fig. 1.
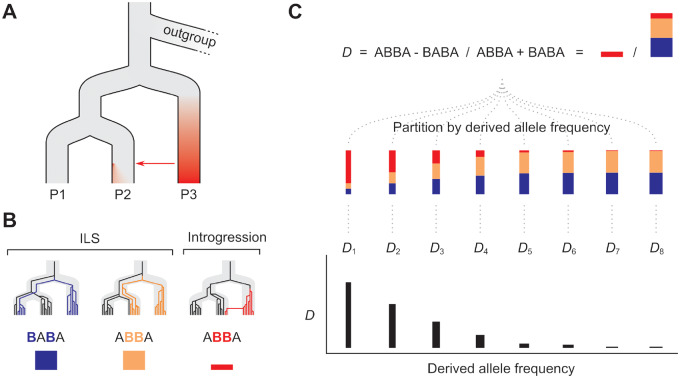
Conceptual representation of the D frequency spectrum. (A) The approach makes use of three focal populations (P1, P2, and P3), in which gene flow is thought to have occurred between P3 and P2. The red shading represents the fact that some derived alleles will have become common within P3 and will be rare or absent in P1 and P2. When these introgress into P2, they will initially occur at low frequency. Through drift, some will increase in frequency over time and others will be lost, creating a distribution of frequencies of introgressed alleles. (B) Three example genealogies that are all discordant with the population branching tree. The first two result from ILS. Mutations on such genealogies can lead to “BABA” and “ABBA” patterns in the sequence data, in which derived alleles (shown in colour) are shared between nonsister taxa. Because ILS involves deep coalescence, these shared derived alleles have time to drift, and can occur at any frequency in populations P1 and P2. The third genealogy represents introgression from P3 into P2. Because there is limited time for drift to occur, shared derived alleles resulting from recent introgression will tend to occur at lower frequency in the recipient population (P2). (C) D is the difference in the observed number of ABBA and BABA patterns in the genome, normalized by their sum. D > 0 indicates an excess of ABBA due to introgression. DFS is computed by partitioning ABBA and BABA counts according to the frequencies of derived alleles in both P1 and P2 (see Materials and Methods for details). With recent introgression, we expect DFS to peak at low frequencies, because this is where ABBA patterns resulting from introgression will be most abundant relative to both the ABBA and BABA patterns resulting from ILS. The total number of sites contributing to each partition or “bin” will differ, and each will contribute differently to the overall D. To show this, each bin is assigned a weighting, illustrated by the width of the vertical bars.

