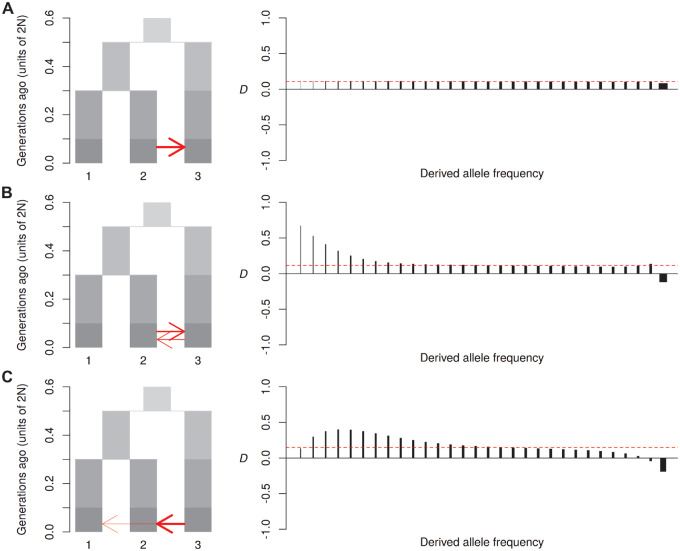
Fig. 4.
Behavior under more complex scenarios. Diagrams on the left show the simulated models of “outward” gene flow from P2 to P3 (A) (2Nm = 2), bidirectional gene flow (B) (2Nm = 2 and 1, respectively) and gene flow from P3 into both P2 and P1 (C) (2Nm = 3 and 0.5, respectively). Plots on the right show DFS (see fig. 2 for details).

