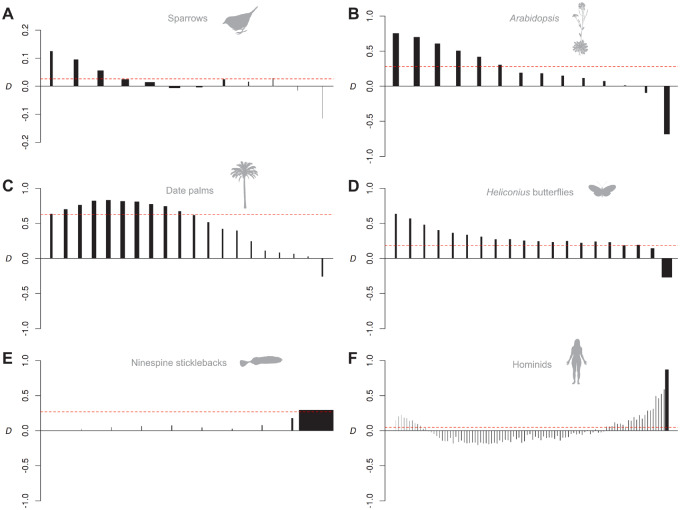
Fig. 5.
Analysis of six published data sets. DFS for gene flow between sparrows Ammospiza caudacuta and A. nelsoni (A), tetraploid Arabidopsis lyrata and Ar. arenosa (B), Date palm Phoenix dactylifera and P. theophrasti (C), butterflies Heliconius timareta and H. melpomene amaryllis (D), sticklebacks Pungitius pungitius and P. sinensis (E), and Neanderthals and humans (F). Each vertical line indicates the stratified D value for each derived allele frequency bin (Dk, see Materials and Methods for details). Widths of vertical lines are drawn in proportion to their weighting. Horizontal dashed lines indicate the genome-wide D value. Differences in the number of bars among plots reflect the different sample sizes available for each system. Note that y-axis scales vary.

