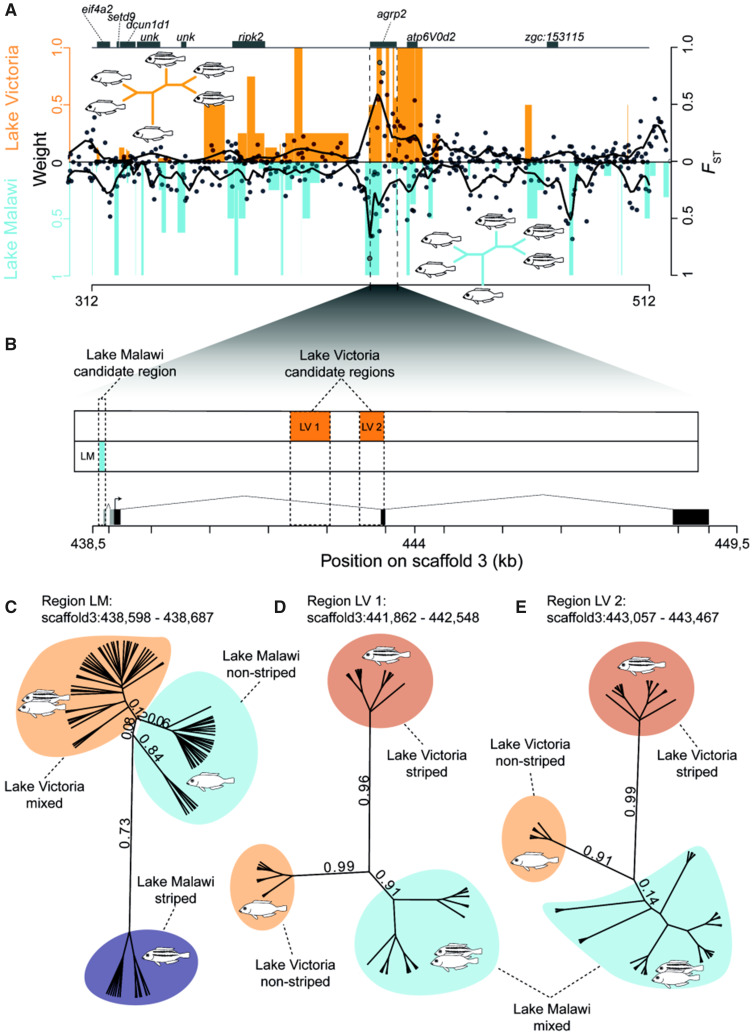
Fig. 2.
The same gene but different lake-specific regulatory regions are associated with the repeated evolution of stripe patterns in the adaptive radiations of haplochromine cichlids of Lakes Malawi and Victoria. (A) Association of stripes with genomic regions. Black dots represent midpoints of every associated region (FST value) as identified by Saguaro and black lines are smoothened local regressions between striped and nonstriped species from Lake Victoria (top) and Lake Malawi mbuna species (bottom). This is plotted together with topology weights for topologies in which striped and nonstriped species are reciprocally monophyletic (orange bars Lake Victoria, blue bars Lake Malawi mbuna). Each value gives the proportionate contribution of a particular taxon tree to the full tree with values ranging from 0 to 1. An example for such a topology in which striped species are reciprocally monophyletic is provided for both radiations. (B) Gene structure of agrp2 with regions of elevated FST (FST > 0.75). Gray boxes indicate two isoforms of the 5′-UTR that harbors variants associated with stripe divergence in Lake Malawi mbuna cichlids. (C) Unrooted gene tree from the region of highest differentiation in Lake Malawi (LM, 90 bp). The two monophyletic groups of nonstriped Malawi cichlids differ in two variants at positions 438,598 and 438,657 (fig. 3 and supplementary fig. S2, Supplementary Material online). Numbers represent posterior probabilities. (D) Unrooted gene tree inferred from the region of highest differentiation in Lake Victoria (LV 1, 687 bp). (E) Unrooted gene tree from the region of second highest differentiation in Lake Victoria (LV 2, 411 bp).

