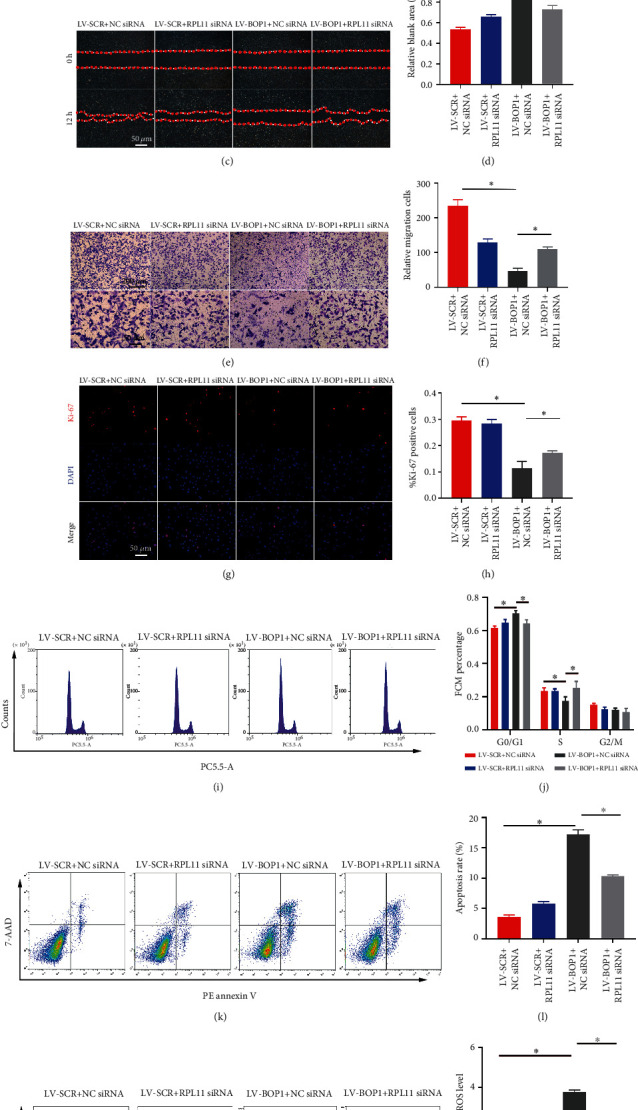
Figure 5.

RPL11 knockdown partly reserved the biological effects of LV-BOP1 on HVSMCs. (a, b) The representative western blot bands and relative expression levels of RPL11 in HVSMCs after transfection with NC siRNA or RPL11 siRNA (n = 3). (c–f) HVSMCs transfected with LV-SCR or LV-BOP1 followed by 50 nM NC siRNA or RPL11 siRNA pretreatment for 24 h. HVSMCs were resuspended and cotreated with 20 ng/ml PDGF-BB for the scratch test. Images were captured by phase-contrast microscopy. Diagram showed quantification of cell migration rate over time. Transwell assay was performed to assess HVSMC migration. The quantification of migrated cells through Transwell chamber was presented. (n = 3), ∗P < 0.05. (g, h) The representative Ki-67 (red) immunofluorescence staining images (n = 3) and the positive cell rate of HVSMCs transfected with LV-SCR or LV-BOP1 followed by 50 nM NC siRNA or RPL11 siRNA were presented. (n = 3), ∗P < 0.05. (i, j) HVSMCs transfected with LV-BOP1 or LV-SCR were treated with 50 nM NC siRNA or RPL11 siRNA. The proportion of cells in each phase of the cell cycle was determined by flow cytometry (n = 3). (k, l) Apoptosis was assessed by Annexin V-APC/7-AAD staining and flow cytometry (n = 3). (m, n) ROS were detected by DCFH-DA and flow cytometry (n = 3). Data are represented by mean ± SD. ∗P < 0.05; one-way ANOVA followed by Tukey's post hoc test for (d, f, h, j, l, n) and Student's t-test for (b).
