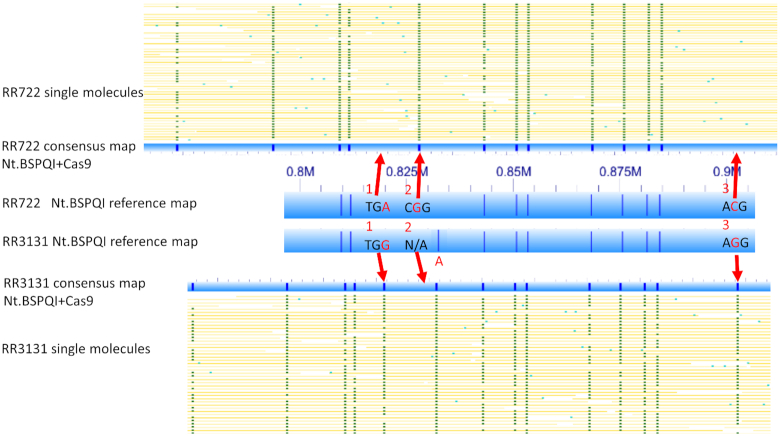
Figure 1.
Interrogation of individual bases with CRISPR–Cas9 labeling. Yellow lines indicate single molecules. The thick blue bars represent Nt.BSPQI reference map. The narrower blue bar represent consensus map of combined Nt.BSPQI CRISPR–Cas9 labeling. Red arrows and bases indicate the single base differences between the two strains. Additional details can be found in the Table 1.

