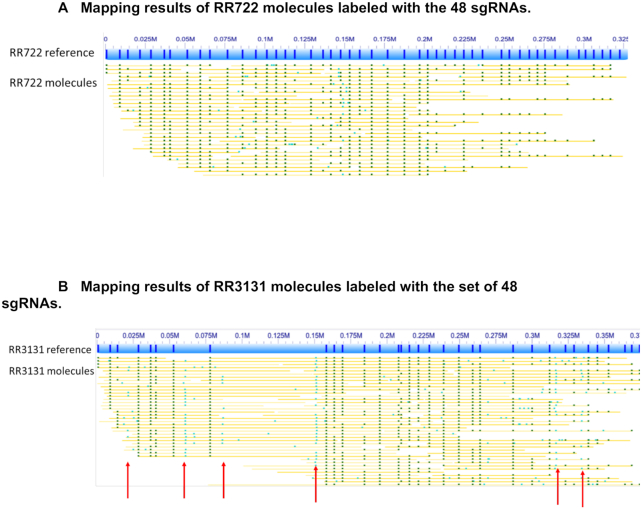
Figure 3.
(A) Mapping results of RR722 molecules labeled with the 48 sgRNAs (Supplementary Table S1). The lines in the blue bar (designed reference map of RR722) represent the locations of the 48 sgRNAs on RR722. The yellow lines below the reference are labels with dark green dots representing where labels matched to the reference and light green dots representing labels not found in the reference. (B) Mapping results of RR3131 molecules labeled with the set of 48 sgRNAs (Supplementary Table S1). The lines in the blue bar (designed reference map of RR3131) represent the locations of the 48 sgRNAs on RR3131. The yellow lines below the reference are labels with dark green dots representing where labels matched to the reference map and light green dots representing labels not found in the reference map. The red arrows indicate the off-target labeling.

