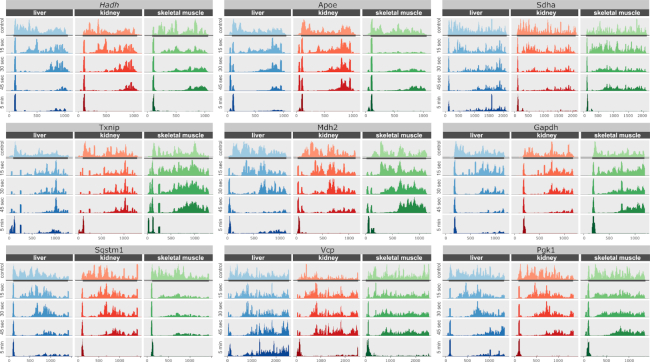
Figure 4.
Ribosome footprint profiles of representative transcripts. Transcripts were selected among those highly expressed in three organs: liver, kidney and skeletal muscle. For each transcript, the entire ORF was selected with extra 100 nucleotides from 5′- and 3′-UTRs. The ribosomal run-off is a consequence of the harringtonine injection. The entire ORF with 100 nucleotides from the 5′ and 3′ UTRs is shown. The sharp peak on the left side of each plot corresponds to ribosomes stalled at the translation start site by harringtonine. Annotated ORF is marked with the grey rectangle.

