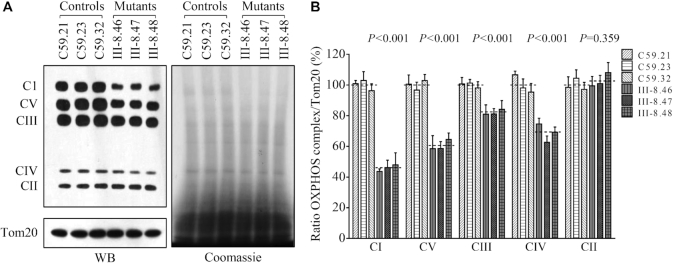
Figure 7.
Blue-native gel analysis of OXPHOS complexes. (A) The steady-state levels of five OXPHOS complexes by Blue-Native gel electrophoresis. Thirty microgram of mitochondrial proteins from mutant and control cell lines were electrophoresed through a Blue-Native gel, electroblotted and hybridized with antibody cocktail specific for subunits of each OXPHOS complex as well as Tom20 and Coomassie staining as a loading control. (B) Quantification of levels of complexes I, II, III, IV and V in mutant and control cell lines. The calculations were based on three independent experiments. Graph details and symbols are explained in the legend to Figure 4.

