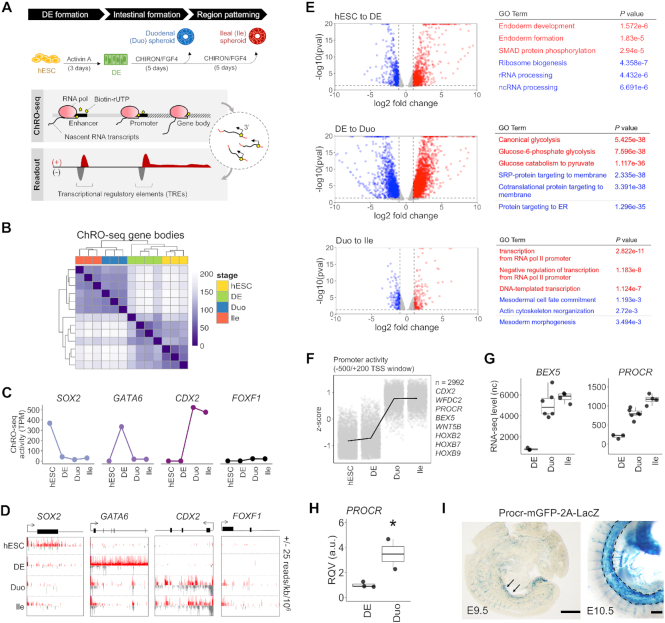
Figure 1.
ChRO-seq defines dynamics of nascent transcription at promoters and gene loci during directed differentiation from hPSCs to small intestinal (SI) spheroids with regional specification. (A) Schematic diagram of the distinct stages of directed differentiation and the genome-scale approach of ChRO-seq. (B) Hierarchical clustering analysis of gene transcription profiles across all stages of the model. (C) Transcriptional activity (ChRO-seq signal) of the genes SOX2, GATA6, CDX2 and FOXF1 across all stages of the model. (D) Normalized ChRO-seq signal at the gene bodies of SOX2, GATA6, CDX2 and FOXF1 across all stages of the model. Scale (±25 reads/kb/106) is fixed across stages. (E) Volcano plots showing differentially transcribed genes in the indicated comparisons (average TPM > 25, log2 fold change of transcription > 1, padj < 0.2 and P < 0.05 by Wald test; DESeq2). Results of pathway enrichment analyses of up-transcribed (red) and down-transcribed (blue) genes in the indicated comparisons (GO Biological Process 2018) are also shown. (F) Identification of protein-coding genes that have high promoter activity in SI spheroids (n = 2992) through application of the likelihood ratio test across all stages. (G) Expression levels (RNA-seq) of BEX5 and PROCR in stages of DE and SI spheroids. (H) RT-qPCR of PROCR in an independent batch of samples (DE = 3; Duo spheroid = 2). *P < 0.05 by one-tailed t-test (validation of sequencing data). (I) X-gal staining for β-galactosidase activity of Procr-mGFP-2A-LacZ mouse reporter line showing a robust Procr expression in midgut at E9.5 (left; arrowhead) and E10.5 (right; dashed outline). Scale bar = 500 μm. ChRO-seq study: hESC, n = 3; DE, n = 4; Duo spheroid (Duo), n = 3; Ile spheroid (Ile), n = 3. RNA-seq study: hESC, n = 2; DE, n = 3; Duo, n = 6; Ile, n = 4. TPM, transcripts per million. nc, normalized counts. RQV, relative quantitative value.

