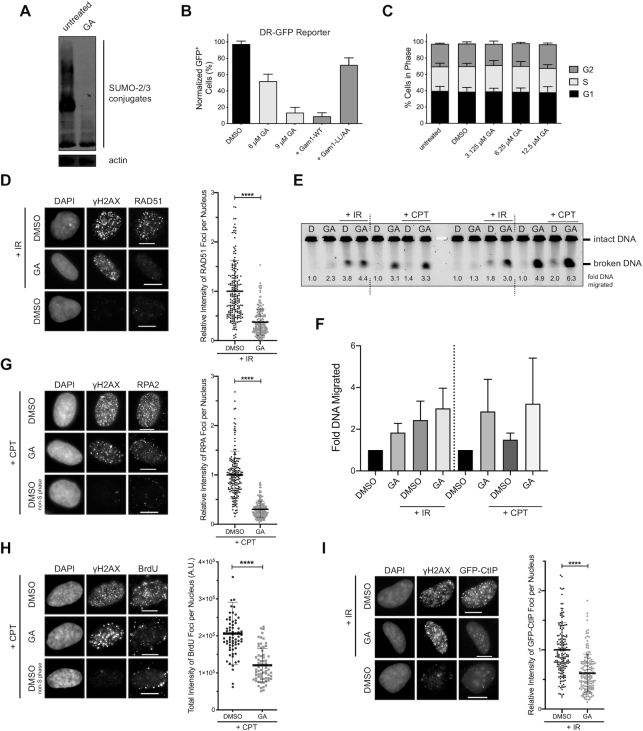
Figure 1.
SUMOylation events mediate homologous recombination and DNA end resection. (A) U-2 OS cells were treated with ginkgolic acid 15:1 (GA) at 25 μM for 3 h. A reduction in SUMO-2/3 conjugates is seen upon GA treatment by immunoblot. (B) DR-GFP homologous recombination reporter assay in U-2 OS cells stably expressing the DR-GFP cassette. I-SceI was expressed for 24 h in the presence of 0.025% DMSO (vehicle control), GA at the indicated concentrations, or co-expression of FLAG-tagged wildtype (WT) Gam1 or the LL/AA mutant. The means from two independent experiments are displayed. (C) U-2 OS cells were treated with 0.025% DMSO or GA at the indicated concentrations for 24 h and processed for DNA content analysis. Shown are the means from three independent experiments. (D) U-2 OS cells were pre-treated with 12 μM GA or 0.024% DMSO for 1 h, subjected to 10 Gy of IR or not, and recovered for 3 h in the presence of GA. Immunofluorescence (IF) micrographs presented are representative of at least four independent experiments (left panel). The total RAD51 foci intensity was quantified from ≥179 RAD51 foci-positive cells per condition from three independent experiments (right panel). (E) U-2 OS cells were pre-treated with 0.024% DMSO (D) or 12 μM GA (GA) for 2 h, then either exposed to 20 Gy of ionizing radiation (IR), treated with 1 μM CPT for 1 h in the presence of DMSO or GA, or not. 1 × 10⁶ cells per condition were embedded into agarose plugs and digested with Proteinase K. Each plug was cut in half, and both halves were resolved by pulsed-field gel electrophoresis. The representative gel shown has duplicate halves from one experiment run simultaneously (left and right). Intensities of the migrated and immobile DNA bands were quantified and used to calculate relative DNA migration, which is presented below each lane and indicates the quantity of DSBs induced. (F) Quantification of relative DNA migration from the gel in (E), averaged with data from a second independent replicate. (G and H) Left panels: IF micrographs of U-2 OS cells pre-treated with 12 μM GA or 0.024% DMSO for 2 h, after which 1 μM camptothecin (CPT) was added for an additional hour. As only cells in S phase are sensitive to CPT, cells that did not respond to CPT are also presented. Right panels: In (G), ≥178 γH2AX+ cells per condition from three independent experiments were quantified for total RPA2 foci intensity. In (H), ≥66 γH2AX+ cells per condition from one experiment were quantified for total BrdU foci intensity. Cells in (H) were cultured in BrdU-containing media prior to treatment. (I) IF micrographs (left panel) of U-2 OS cells stably expressing GFP-CtIP pre-treated with 12 μM GA or 0.024% DMSO for 1 h, subjected to 10 Gy of IR or not, and recovered for 4 h in the presence of GA. Right panel: the total GFP-CtIP foci intensity was quantified from ≥158 GFP-CtIP foci-positive cells per condition from three independent experiments. Micrographs in (G–I) are representative of the results from at least six independent experiments.

