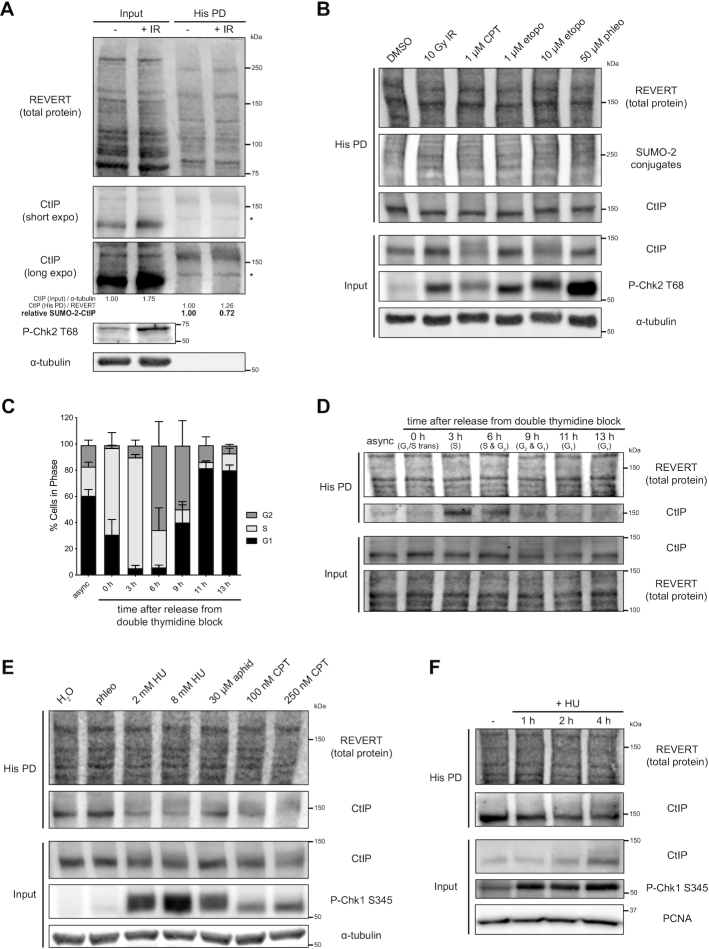
Figure 3.
Analysis of CtIP SUMOylation status in S phase and in response to double-strand breaks and replication stress. (A, B, D, E, F) HeLa His10-SUMO-2 cells were treated as indicated, portioned into input and His PD fractions and processed accordingly before SDS-PAGE and immunoblotting. Chk2 and Chk1 phosphorylation were used as readouts for the induction of DSBs or replication stress, respectively. (A) Asynchronous cells were subjected to 10 Gy of IR or not and allowed to recover for 1 h. Shown is a representative result of three independent experiments. * indicates a non-specific immunoreactive band. Corresponds to Supplementary Figure S4A. (B) Asynchronous cells were exposed to 10 Gy of IR and allowed to recover for 1 h, or subject to CPT, etoposide (etopo), or phleomycin (phleo) at the indicated concentrations for 1 h. Shown is a representative result of four independent experiments. CtIP typically exhibits smearing upon treatment with high dose CPT (67) and etoposide (input fraction). (C) HeLa His10-SUMO-2 cells were left asynchronous (async) or synchronized by double thymidine block and released for various timepoints to reach different cell cycle phases, then a portion was processed for DNA content analysis. Shown are the means from three independent experiments. (D) As in (C), but this time processed for immunoblot of input and His PD fractions. Shown is a representative result of three independent experiments. (E) Asynchronous cells were subject to 25 μM phleomycin for 1 h or the indicated replication stress inducing agents for 4 h. 0.8% H2O served as the vehicle control; aphidicolin (aphid); hydroxyurea (HU). Shown is a representative result of three independent experiments. (F) Asynchronous cells were treated with 2 mM HU for the indicated timepoints or not treated for 4 h. Shown is a representative result of at least three independent experiments.

