
Figure 4.
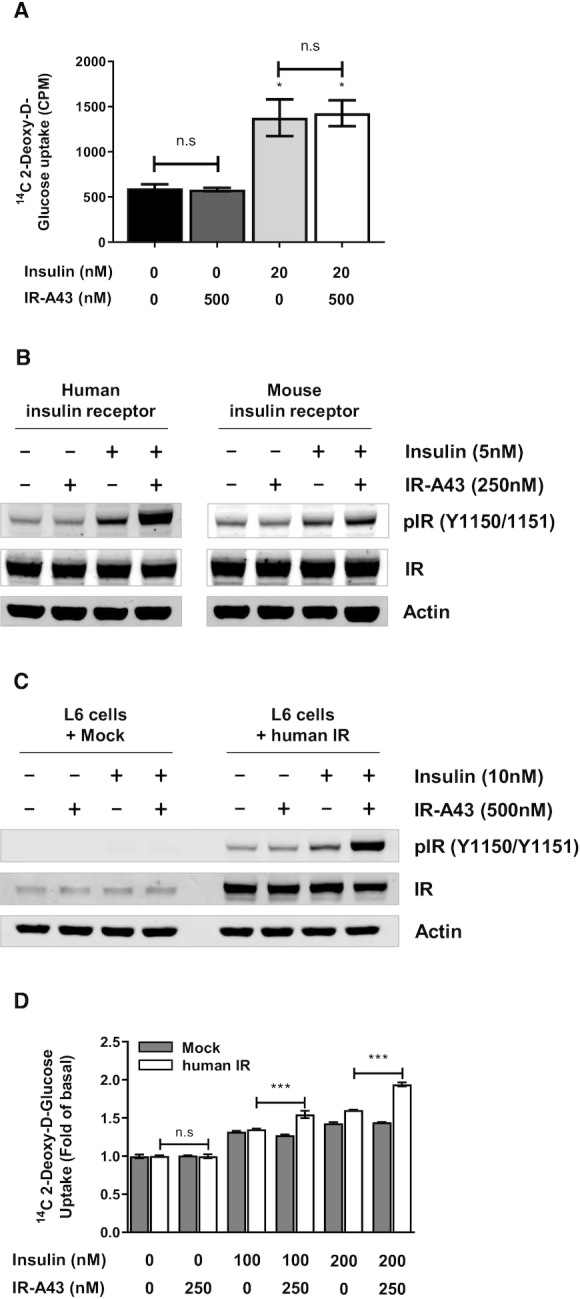
IR-A43 does not potentiate the activity of the mouse insulin receptor. (A) Fully differentiated 3T3-L1 adipocytes were used to measure insulin-stimulated glucose uptake. Cells were stimulated with 500 nM IR-A43, 20 nM insulin, or 20 nM insulin with 500 nM IR-A43 for 30 min. Data are presented as mean ± standard deviation (SD) of three biological replicates. (B) The human or mouse insulin receptor was transfected into CHO-K1 cells using Lipofectamine 3000 reagent. After 72 h, the cells were stimulated with 250 nM IR-A43, 5 nM insulin or 5 nM insulin with 250 nM IR-A43. (C) The human insulin receptor was transfected into L6 myoblast cells using Lipofectamine 3000 reagent. After 72 h, the cells were stimulated with 500 nM IR-A43, 10 nM insulin, or 10 nM insulin with 500 nM IR-A43. (D) L6 cells transfected with the human insulin receptor were used to measure insulin-stimulated glucose uptake. Cells were stimulated with 250 nM IR-A43, 100 nM insulin, 100 nM insulin with 250 nM IR-A43, 200 nM insulin, or 200 nM insulin with 250 nM IR-A43 for 30 min. Data are presented as mean ± standard deviation (SD) of three biological replicates. P-values were determined by one-way ANOVA followed by Tukey's multiple comparisons test (***P < 0.001 and ns, not significant).