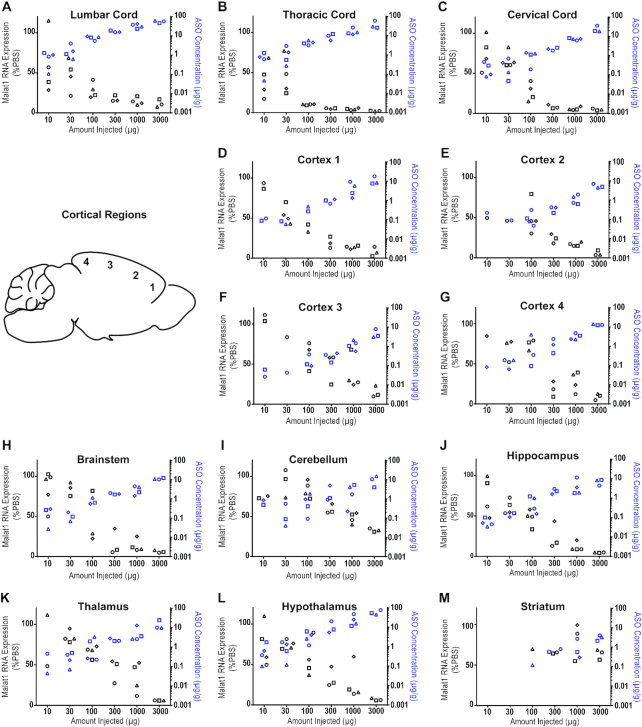
Figure 3.
Dose responsive Malat1 RNA reduction and ASO accumulation in rat CNS tissue. Real-time RT-PCR analysis and the Malat1 ASO tissue concentration (black and blue symbols respectively) are plotted for each animal in each dose for spinal cord (A) lumbar, (B) thoracic and (C) cervical (D–G) cortex regions 1–4, (H) brainstem, (I) cerebellum, (J) hippocampus, (K) thalamus, (L) hypothalamus and (M) striatum. Malat1 ASO concentrations for all CNS regions for all doses were measured by LC/MS. The left Y axis is for RNA levels which are plotted as % PBS control and the right Y axis is for ASO concentrations which are plotted as μg ASO per gram of tissue. PBS, phosphate-buffered saline.

