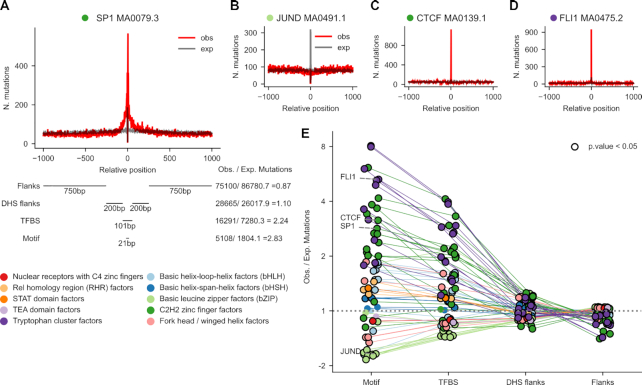
Figure 1.
Mutation rate at TFBS in melanomas. (A) 2001-nucleotide sequences centered at the middle point of active TFBS are extracted from the genomic sequence. Within each sequence four areas are delimited: (from the center to the periphery) motif (21 bp), TFBS (101 bp that contain the motif), DHS flanks (400 bp), and flanks (1500 bp). The somatic mutations identified in a cohort of 136 melanomas are mapped to these sequences. Then, all 2001-nucleotide sequences containing the same type of binding motif of a TF are stacked. Mutations at each position of the stack are summed across the sequences, and the expected distribution of mutations across the 2001-nucleotide stack is computed from the profile of tri-nucleotide whole-genome substitution frequencies observed across the cohort. (A–D) The observed (red) and expected (gray) distributions of mutations in the stack of 2001-nucleotide sequences centered around the MA1107.1 binding motif of KLF9 (A), the MA0491.1 binding motif of JUND (B), the MA0139.1 binding motif of CTCF (C), and the MA 0475.2 binding motif of FLI1 (D). (E) Ratio of observed to expected mutations (in log2 scale) within the four regions defined across the stacks of 2001-nucleotide sequences centered across 64 types of TF binding motifs with >5000 sequences and a median number of mutations across all positions >2. Positive values correspond to higher-than-expected mutation rates at each region, whereas lower-than-expected mutation rates possess negative values. Points that correspond to instances of significant deviation from the expectation (G-test P-value<0.05) are encircled in black. The thin straight lines join the values computed for the regions of a given type of motif. The circles corresponding to each type of motif are colored according to the family of the corresponding TF, following the legend presented next to the panel.

