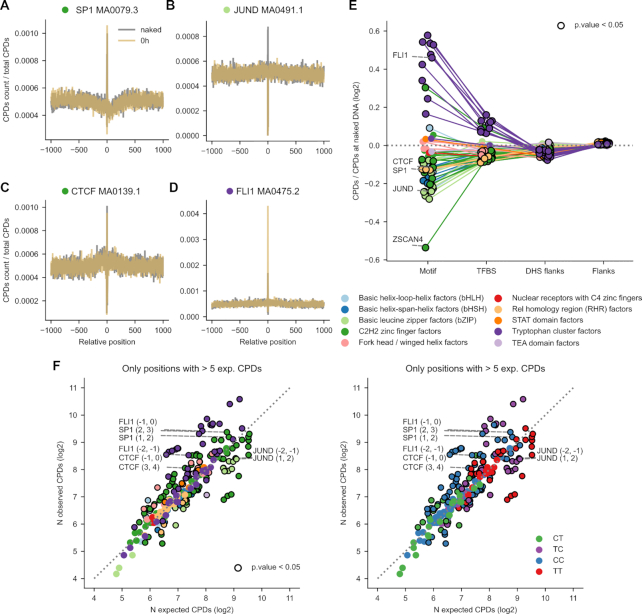
Figure 3.
CPD formation rate at TFBS. (A–D) Distribution of the observed (amber) or expected (dark gray) rate of CPDs formed upon UV irradiation within 2001-nucleotides sequences centered at the middle position of the TFBS shown in Figures 1 and 2. (E) Ratio of observed to expected CPDs formation rates (in log2 scale) within the four regions studied. Positive values correspond to higher-than-expected CPD formation rates at each region, whereas lower-than-expected CPD formation rates possess negative values. Points representing instances with significant deviations from the expectation (G-test P-value < 0.05) are encircled in black. Thin straight lines join the values computed for the regions of a given type of motif. (F) Scatterplots representing the relationship between the number (log2) of observed and expected CPDs formed at specific dipyrimidine positions within each type of motif. In the left plot, the dots representing the motifs are colored following TF families, while in the right plot, their colors correspond to the type of dipyrimidine where they occur.

