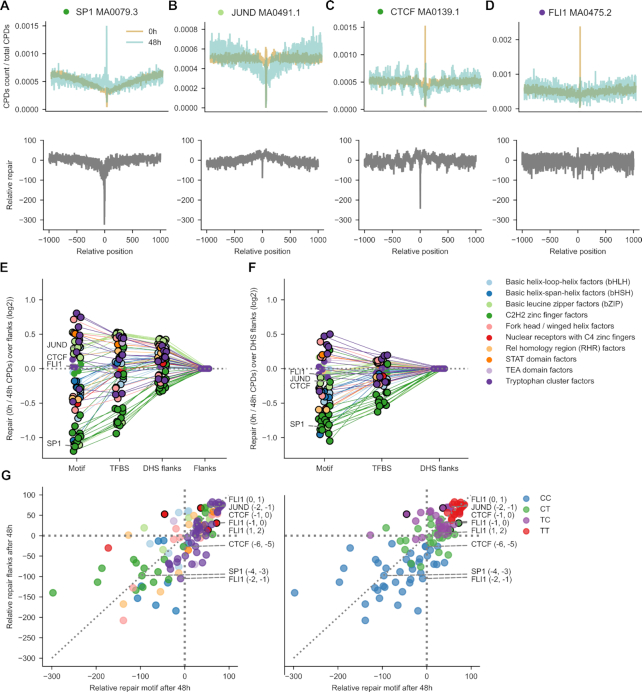
Figure 4.
Relative repair of CPDs at TFBS. (A–D) Relative activity of repair of CPDs in the four TF binding motifs presented in previous Figures. Top panels represent the rate of CPDs experimentally generated immediately after irradiation (0h, ambar) and the rate of CPDs persisting 48 h (blue) after irradiation. (Both CPD rates are computed relative to the number of CPDs across the entire TFBS.) The subtraction of the latter from the former, nucleotide-by-nucleotide yields the relative rate of repair across each type of binding motif. (E) Ratio of the relative repair rates of CPDs at motifs, TFBS or DHS flanks with respect to flanks (in log2 scale). Positive values correspond to relative CPD repair rates that are larger at a given region than at the flanks, whereas lower-than-flanks mutation ratios possess negative values. Points encircled in black represent instances of significant deviation from the expectation (G-test P-value < 0.05). Thin straight lines join the values computed for the regions of a given type of motif. The points representing the ratios computed for each region of each type of motif are colored according to the family of the corresponding TF, following the legend presented next to the panel. (F) Ratio of the relative repair rates of CPDs at motifs or TFBS with respect to DHS flanks (in log2 scale). Notation as in panel (E). (G) Scatterplots representing the relationship between the percent of repaired CPDs at specific dipyrimidine positions within individual motifs (after 48 h) and the average repair rate for the same type of dipyrimidine in the same context (tetranucleotide) within the flanks. Each dot corresponds to an individual dipyrimidine. Dots above the diagonal represent dipyrimidines repaired at a higher rate than dipyrimidines in the same context in the flanks. On the other hand, dots below the diagonal correspond to dipyrimidines at positions that experience lower relative repair rate.

