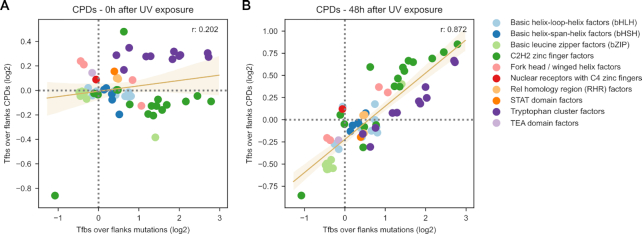
Figure 5.
The UV mutational process in TFBS. (A) Relationship between the ratio (log2) of TFBS-to-flanks CPDs (y-axis) computed immediately after irradiation and the ratio (log2) of TFBS-to-flanks mutations (x-axis). (B) Relationship between the ratio (log2) of TFBS-to-flanks CPDs (y-axis) computed 48 h after irradiation and the ratio (log2) of TFBS-to-flanks mutations (x-axis). Dots represent specific motifs. The trendline and the Pearson's correlation coefficients computed for both relationships are presented in the graph.

