Figure 4.
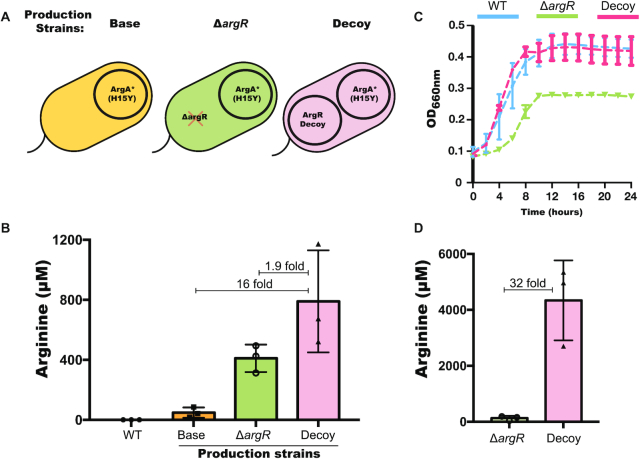
Titer and growth curves of arginine production strains. (A) Schematic view of the arginine production strains. (B) Arginine titer of production strains in 5 ml culture measured by LC–MS after 24 h. (C) Growth curves of different arginine production strains. Error bars show standard deviations from n = 3 biological replicates. (D) Arginine titer of production strains in 100 ml culture measured by LC–MS after 24 h.

