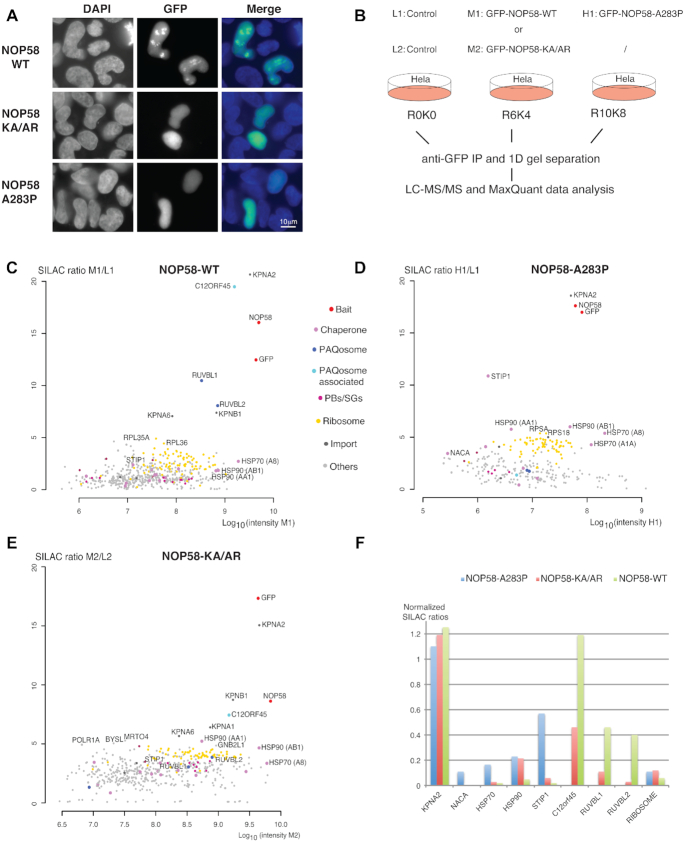
Figure 1.
Identification of early assembly intermediates with NOP58 mutant proteins. (A) Epifluorescence microscopy images of HeLa cells expressing wild type (WT) or mutant GFP fusions of NOP58 (NOP58-KA/AR or NOP58-A283P). Blue/left panels: DAPI staining; Green/middle panels: GFP. Scale bar is 10 μm. (B) Schematic representation of SILAC IP experiments shown in C, D and E. First experiment was done with three conditions (L1: light label for control done with parental HeLa cells; M1: medium label for GFP-NOP58-WT; H1: heavy label for GFP-NOP58-A283P) and second with two conditions (L2: light label for control; M2: medium label for GFP-NOP58-KA/AR). (C–E) Proteomic analyses of the partners of GFP-NOP58-WT (C), GFP-NOP58- A283P (D) and GFP-NOP58-KA/AR (E). Graphs display SILAC ratios (y axis, specific versus control IP) as a function of signal abundance (x axis, log10(intensity)). Each dot represents a protein and is color encoded according to the classification shown between panels C and D. The labeled dots highlight proteins relevant to this study. Full hit list with Significance B values are given in Supplementary Table S1. (F) Bar plot comparing SILAC ratios shown in C, D and E for a few selected partners. In each experiment, the normalization is done by dividing the SILAC ratio of the protein of interest with that of NOP58. Blue bars are for NOP58-A283P, red bars for NOP58-KA/AR and green bars for NOP58-WT.

