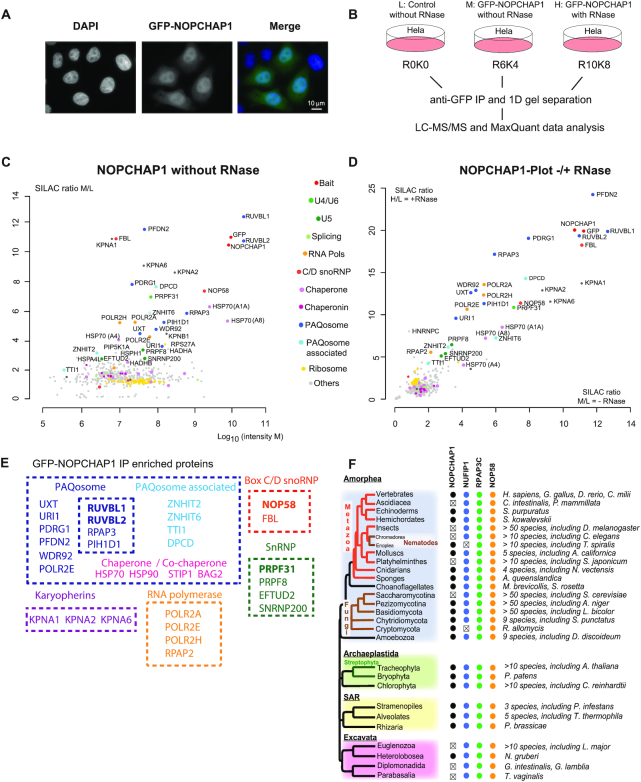
Figure 3.
Characterization of NOPCHAP1. (A) Epifluorescence microscopy images of HeLa cells expressing GFP-NOPCHAP1. Blue/left panel: DAPI staining; Green/middle panel: GFP. Scale bar is 10 μm. (B) Schematic representation of SILAC IP experiments shown in C and D. (C) Proteomic analyses of the partners of GFP-NOPCHAP1. This IP is done without RNase treatment. Full hit list with Significance B values are given in Supplementary Table S3. Legend as in Figure 1 for graphic representation. (D) Comparison of GFP-NOPCHAP1 interactome in presence or in absence of RNase. SILAC ratios from condition with RNase (y axis, shown in Figure S2A) or without RNase (x axis, shown in C) were plotted against each other. (E) Scheme showing groups of NOPCHAP1 interactants found in our SILAC IPs and grouped according to the known complexes in which they belong. (F) Conservation of NOPCHAP1, NUFIP1, RPAP3-Cter (Cterminal domain) and NOP58 across Eukaryotes. Members that were not found are indicated by ‘x’. In Alveolates, NOPCHAP1 and NUFIP1 were not found in Perkinsea.

