Figure 5.
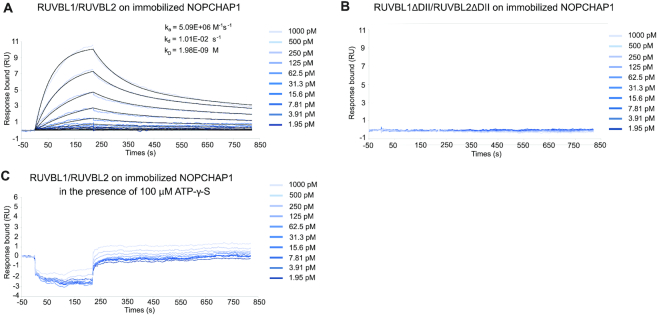
SPR binding assays between NOPCHAP1 and RUVBL1/2. The graphs depict the immobilized NOPCHAP1 response upon injection of RUVBL1/2 in the presence and absence of 100 μM ATP-γ-S (A and C, respectively) and RUVBL1-ΔDII/RUVBL2-ΔDII (B) (t = 0 s) at different concentrations or upon washing (t = 220 s). X-axis: time (s); Y-axis: response (arbitrary units). All assays were performed in triplicates.

