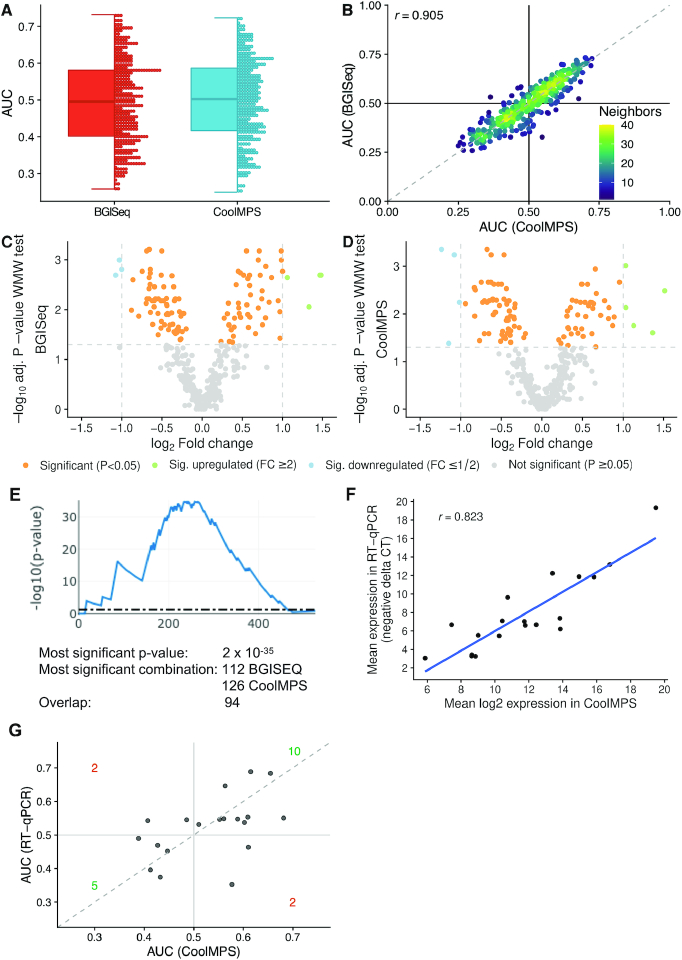
Figure 4.
Diagnostic performance on dementia patients. (A) Distribution of the AUC values to differentiate between dementia and controls obtained for both technologies. An AUC of 0.5 means no dys-regulation. A deviation from 0.5 toward one means an upregulation and toward zero a downregulation of the biomarkers. The distribution is shown as boxplot (left) and dotplot (right). Each miRNA is shown as one dot. The boxes span the first to the third quartile with the horizontal line inside the box representing the median value. The whiskers show the minimum and maximum values or values up to 1.5 times the interquartile range below or above the first or third quartile if outliers are present. (B) Scatter plot of the AUC values to differentiate between dementia and controls in CoolMPS (x-axis) versus BGISEQ (y-axis). The black horizontal and vertical line represent the AUC value of 0.5, respectively. The Pearson correlation is shown in the upper left part of the plot. The points are colored according to the point density in their neighborhood. (C) Volcano plot showing the log2 fold change on the x-axis and the FDR adjusted negative log10 of the Wilcoxon–Mann–Whitney (WMW) P-value on the y-axis for BGISEQ. Orange dots are located above the horizontal line and are significant. Blue and green dots above the horizontal and on the left / right of the vertical lines are significant and have a fold-change above 2. (D) Same volcano plot as in Figure 4C, but for CoolMPS. (E) Result of DynaVenn that presents the negative log10 of the overlap between the two miRNA sets dependent on how many miRNAs are included. The peak of the curve represents the most significant overlap. (F) Scatter plot of the log2 CoolMPS expression (x-axis) and the negative delta CT value for the 19 miRNAs included in the validation study. The Pearson correlation coefficient is shown in the upper left part of the plot. (G) Scatter plot of the AUC values to differentiate between dementia and controls in CoolMPS (x-axis) and BGISEQ (y-axis). The dashed line represents the angle bisector.

