Figure 1.
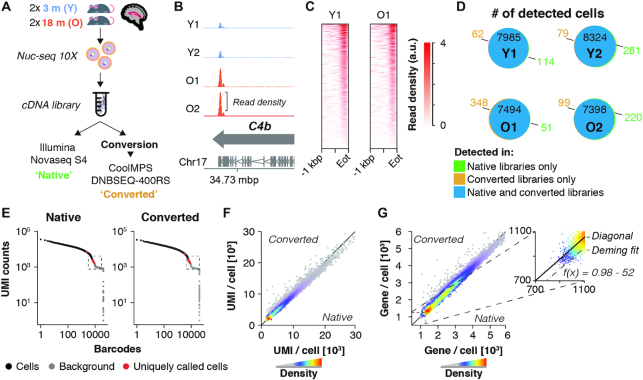
Performance of native and CoolMPS-compatible snRNA-seq libraries. (A) Experiment outline. Four 10 × 3′ snRNA-seq libraries were generated, derived from hippocampi of two young (3 months) and two old mice (18 months). Libraries were sequenced directly using an Illumina Novaseq or chemically converted and sequenced using CoolMPS technology on a DNBSEQ-400RS. Each library was down-sampled to contain 200 mio. paired-end reads per sample and library type. (B) Distribution of aggregated reads from the converted libraries dataset over C4b gene locus, separated by sample. Arrows indicate gene orientation; merged mRNA structure is depicted below. (C) Aligned read distribution of aggregated reads from the converted libraries dataset over the last kilobase pair of all expressed genes (n = 11 132 genes with rpkm > 1 in two or more samples). (D) Venn diagrams depict the number of cells detected in each dataset, split by samples (Y1, Y2, O1, O2). Cells of the same sample exhibiting identical cell barcodes in both datasets are considered identical cells detected by both Illumina and CoolMPS sequencing. Number of cells detected only in the native or converted libraries are colored in green and ochre, respectively. (E) Knee plot of sample Y1, showing UMI counts per cell barcode. Black points represent cells, with cells called only in one library type colored in red. The regions at the cutoff between called cells and empty droplets (labelled ‘background’; marked by the dashed box) are visualized at larger scale in Supplementary Figure S1b. (F, G) Scatterplot showing the cell-wise number of (F) detected UMIs and (G) genes by either library type. Insert shows the zoomed region with Deming regression line, showing a mild offset from the diagonal. Abbreviations: Y1, Y2, young male replicates 1 and 2; O1, O2, old male replicates 1 and 2; Eot, end of transcript; a.u., arbitrary unit; mbp/kbp/bp, megabase pair/kilobase pair/base pair.

