Figure 2.
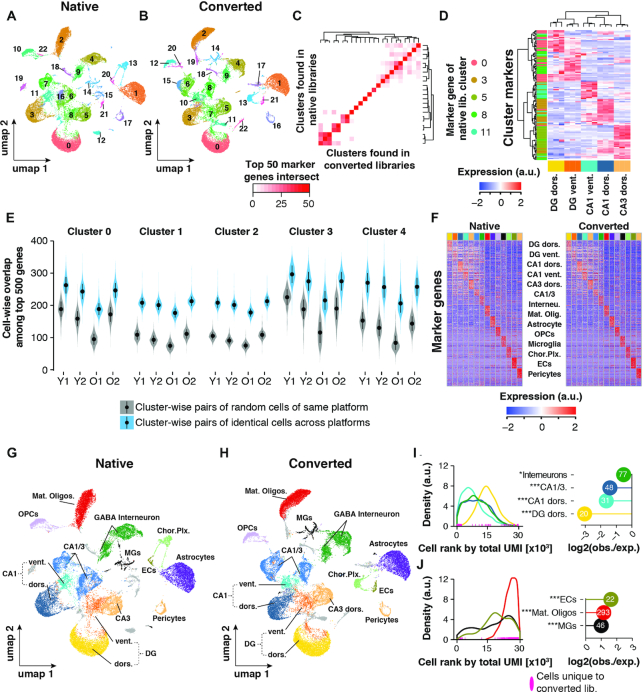
Cell clustering performance across libraries. (A, B) UMAP representation of cells and clustering results of (A) n = 29 945 cells (native libraries) and (B) n = 30 360 (converted libraries), respectively. (C) Heatmap depicting the number of common top 50 genes per cluster as detected in either sequencing run. (D) Identification of spatial origin of five neuronal clusters. We performed hierarchical clustering of the top 30 marker genes (rows) of clusters 0, 3, 5, 8 and 11 as identified in the native dataset. For those marker genes, expression is plotted as measured in a publicly available RNA-seq data of anatomically distinct neurons (columns; n = 3 replicates per neuronal population). Cells within the heatmap are colored to represent row-wise z-transformed expression of given gene across all anatomically distinct neurons. Marker genes are annotated by the row-side color bar, with each marker gene colored by cluster. Expression data was derived from (Cembrowski et al. 2016). (E) Cluster and sample-wise distribution of common top 500 expressed genes between two cells. Cluster number corresponds to the clusters found in the native dataset in (A). Gray violins represent overlaps from cells of the same cluster (biological cell replicates); blue violins represent overlaps from cells with the same barcode, sequenced in both datasets (technical replicates). Means ± SEM. (F) Relative expression of top 30 cell marker genes as found in native library dataset. Each column represents n = 50 of randomly selected cells per cell type. (G, H) UMAP representation of cells with annotated cell types in (G) native and (H) converted library dataset, respectively. (I, J) Analysis of depletion (I) and enrichment (J) of cells found only in the CoolMPS-compatible dataset among neuronal and non-neuronal cell populations. Left-hand panels: Distribution of cell types among all cells, ranked by their total UMI count in descending order (converted libraries only; cell with the highest total UMI count has rank 0). Rank of cells for given cell types that were found only in the CoolMPS-compatible dataset are indicated along the x-axes. Right-hand panels: Y-axis indicates for each cell type the observed-over-expected values for cells that were found only in the CoolMPS-compatible dataset. Absolute number of cells found only in the CoolMPS-compatible dataset are indicated in the bubble. Cell types exhibiting no statistical enrichment or depletion for CoolMPS-unique cells are not shown. ***Padj < 0.001, **Padj < 0.01, *Padj < 0.05, two-sided Fisher's exact test, adjusted for multiple testing. Abbreviations: Y1, Y2, Young male replicates 1 and 2; O1, O2, Old male replicates 1 and 2; DG dors., granule neurons of dorsal dentate gyrus; DG vent., granule neurons of ventral dentate gyrus; CA1 dors., pyramidal neurons of dorsal CA1; CA1 vent., pyramidal neurons of ventral CA1; CA3 dors., pyramidal neurons of dorsal CA3; CA1/CA3 Neur., pyramidal neurons that could not be clearly allocated to CA1 and CA3; GABA interneuron, Gabaergic interneurons; Mat. Oligos, mature oligodendrocytes; OPCs, oligodendrocyte precursors; MGs, microglia; Chor. Plx., choroid plexus cells; ECs, brain endothelial cells; a.u., arbitrary unit; obs./exp., observed over expected.

