Figure 6.

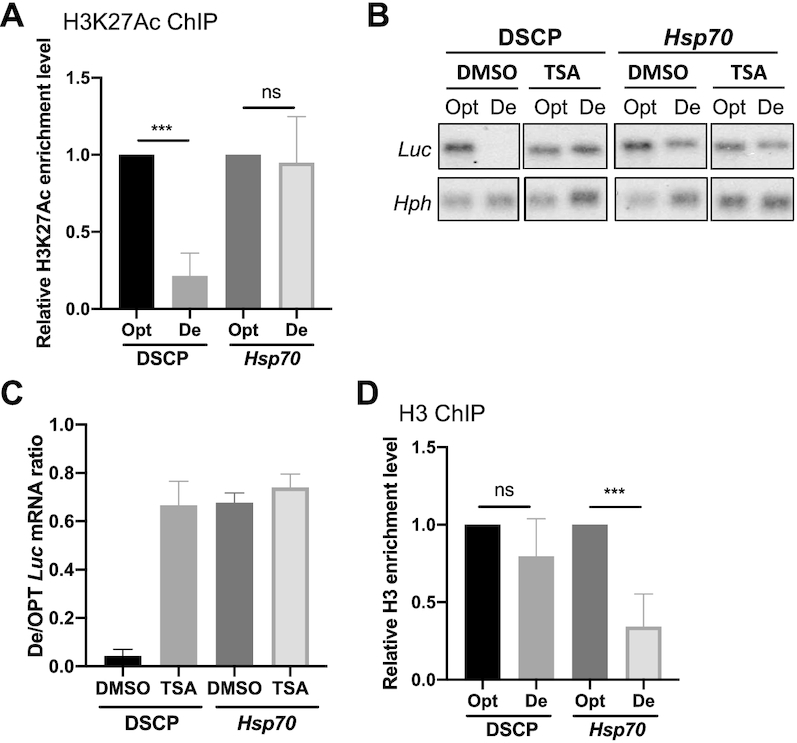
Codon usage and promoter influence H3K27ac levels and histone density, respectively. (A) H3K27ac ChIP assay over the 5′ Myc-tag region of indicated constructs in stably transfected cells. qPCR primers amplify the 5′ Myc-tag sequence, and data were normalized to Act5C (n = 4). (B) Northern blot analysis of De-Luc and Opt-Luc mRNAs expressed under the control of indicated promoters in stably transfected cells treated with DMSO or 150 μM TSA. Probes hybridized to the 5′ Myc-tag for Luc constructs and 5′ region for hph. The hph level was used as a control for transfected plasmid level. (C) Quantification of De-Luc/Opt-Luc ratio normalized to hph for experiment shown in panel C (n = 3). (D) H3 ChIP assay for nucleosome levels at the 5′ Myc-tag region of indicated constructs in stably transfected cells. qPCR primers amplified the 5′ Myc-tag sequence, and data were normalized to a transcription-inactivate region 3L1 (n = 4). Data are means ± SD. **P < 0.01. ns: not significant. Two-sided Student's t-tests were used.
