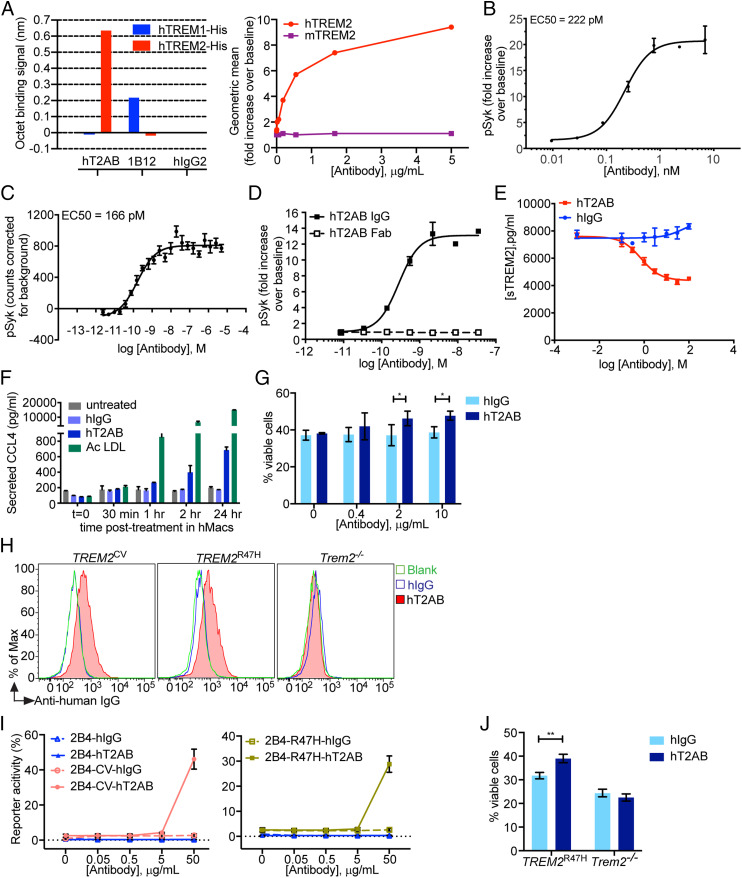
Fig. 1.
hT2AB is a hTREM2 agonistic antibody. (A) hT2AB specifically binds to hTREM2 but does not bind to hTREM1 or mTREM2. The data show the binding signals of hTREM2-His to hT2AB measured by Octet. 1B12 is an anti-hTREM1 antibody that binds exclusively to hTREM1-His. There is no binding to either hTREM1-His or hTREM2-His to irrelevant hIgG2 (Left). hT2AB binds to hTREM2 transiently coexpressed with hDAP12 in HEK293 cells but does not bind to HEK293 cells that express mTREM2 and mDAP12 as measured by flow cytometry (Right). (B, C) Functional EC50 of hT2AB in HEK293 cells stably expressing hTREM2 and hDAP12 (clone G13) (B) and hMacs (C). Activation of hTREM2 was determined by measuring the induction of Syk phosphorylation (pSyk) after exposure of cells to different concentrations of hT2AB (n = 8). (D) Activation of hTREM2 by hT2AB IgG1 and hT2AB Fab was determined by measuring Syk phosphorylation in clone G13 exposed to different concentrations of antibodies (n = 3). (E) Quantification of sTREM2 in conditioned media from hMacs treated with different concentrations of hT2AB or control hIgG1 antibody for 24 h without any immune challenge (n = 4 for each group). (F) Quantification of CCL4 in conditioned media from hMacs treated with hT2AB or control hIgG1 antibody at 200 nM at different time points. Acetylated LDL was used as a positive control (n = 2 for each group). (G) Cell viability assay of BMMs from TREM2CV mice after CSF1 withdrawal were treated with different concentrations of plate bound hT2AB or control hIgG1 for 48 h (n = 3 for each group). (H) Binding assay of hT2AB for BMMs from TREM2CV and TREM2R47H. BMMs from Trem2−/− were used as a negative control. (I) 2B4 reporter cell lines expressing hTREM2 (CV or R47H) were stimulated with different amounts of plate bound hT2AB or control hIgG1. GFP expression was measured by flow cytometry (n = 2 for each group). (J) Cell viability of BMMs from TREM2R47H mice after CSF1 withdrawal treated with plate bound hT2AB or control hIgG1 at 10 μg/mL for 48 h. *P < 0.05; **P < 0.01 by two-way ANOVA with Sidak’s multiple comparisons test. All data in Fig. 1 are shown as mean ± SD except for B and C, which depict mean ± SEM.

