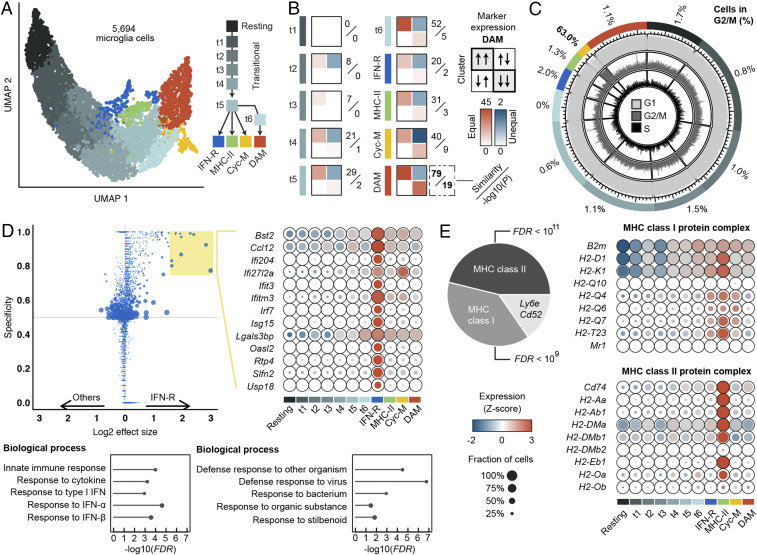
Fig. 4.
Characterization of activated microglia populations. (A) Unsupervised clustering identified 10 distinct subpopulations spanning a trajectory from homeostatic microglia toward four terminal phenotypes. (B) Contingency tables counting agreements (diagonal) and disagreements (off-diagonal) between the expression profile of the DAM population described by Keren-Shaul et al. (9) and each cluster in this study; quantifications are based on (log2) 0.5-fold up- and down-regulated genes relative to the homeostatic population. A similarity score is calculated by subtracting the off-diagonal values from the sum of the diagonal values; P values are calculated testing the overall agreement between both studies. Increasing gene expression similarities along the trajectory from t1 via t6 to the DAM cluster, highlighted in red, can be observed. (C) Scoring of cell cycle states. Each cell was predicted to be either in G1, G2/M, or S phase using machine learning. One cluster highlighted in yellow, Cyc-M, shows strong enrichment of cycling cells. (D) Differential expression analysis reveals one cluster, IFN-R, that shows enrichment of genes related to the interferon pathway (D), and one cluster, MHC-II, enriched in genes encoding members of the MHC class II protein complex (E). The expression of selected marker genes is shown in D, and all MHC class I/II genes as annotated in the GO are shown in E. Fisher’s exact test with false discovery rate (FDR) correction was used for GO term enrichment analysis.

