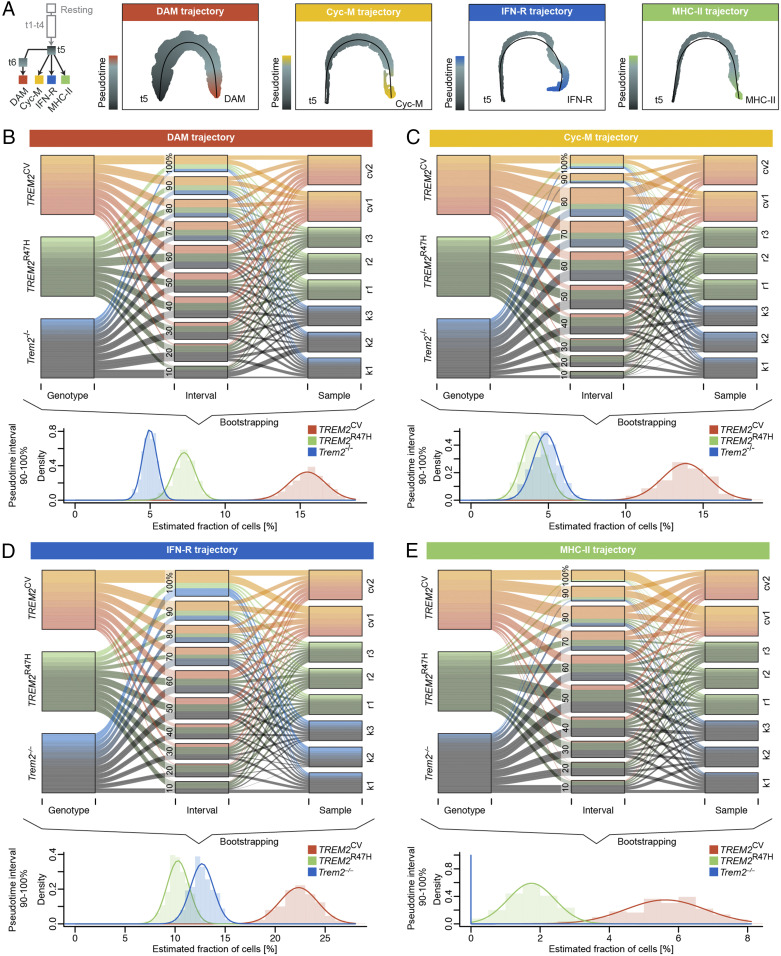
Fig. 5.
Genotype-driven effects on microglia fates. (A) Trajectory tree and visualization of computed linear trajectories from t5 toward each terminal microglia type. Pseudotime was inferred by fitting principal curves (black lines) in the lower dimensional manifold. Each datapoint represents a cell colorized by its pseudotemporal location along the trajectory. (B–E) Alluvial plots showing the relative fraction of each genotype and its replicates over all pseudotime intervals (Upper); representation was corrected for different samples sizes. The lower image shows the distributions of estimated fractions of cells in the 90 to 100% pseudotime interval using Bootstrapping (Lower).

