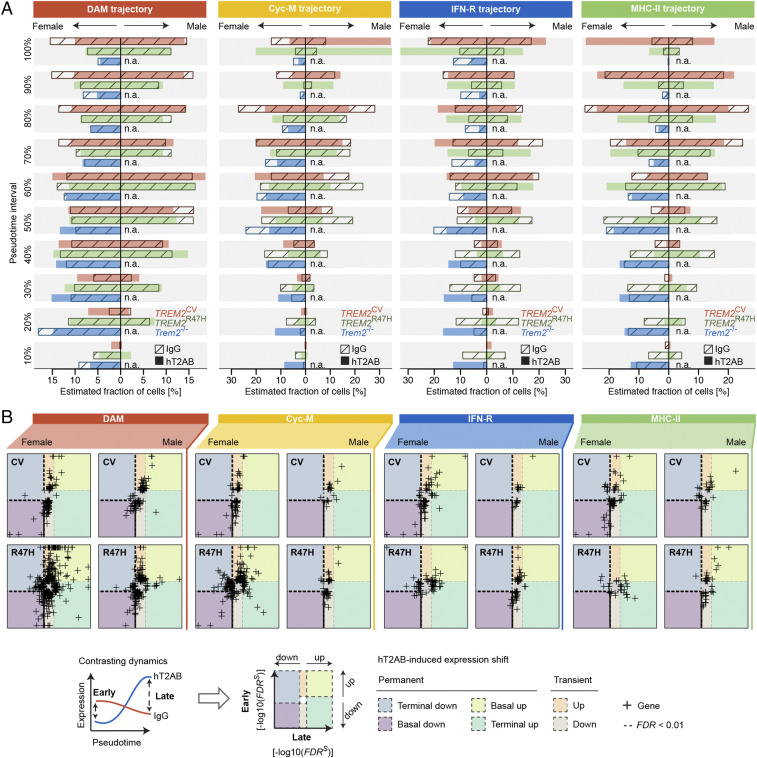
Fig. 6.
hT2AB treatment effects on the microglia trajectory. (A) Estimated relative population sizes per time interval along each trajectory starting from the branching point toward the terminal end type. (B) Trajectory-based differential expression analysis of the early and late microglial differentiation stages. P values were calculated using Wald statistics and corrected for multiple testing via FDR. The FDR was weighted by the sign of the log fold-change S by FDRS and -log10 transformed. Negative values denote hT2AB-induced down-regulation; positive values indicate up-regulation. Using an FDR cutoff of 0.01, transcriptional changes were classified into six categories: two transient with an early up-/down-regulation converging to baseline level and four permanent with either early and late up-/down-regulation or only late up-/down-regulation, respectively.

