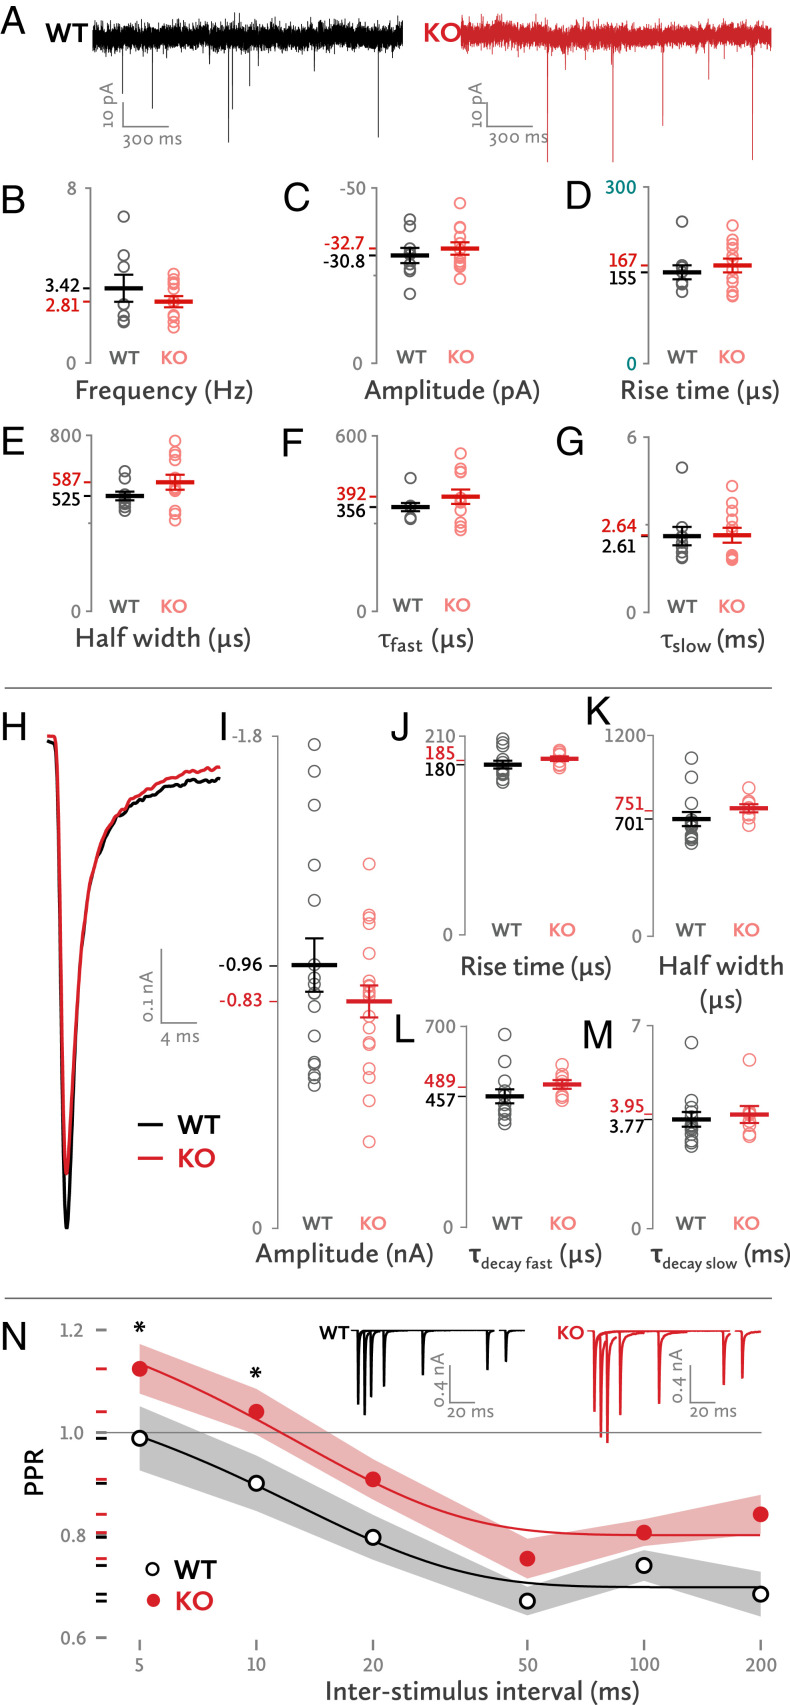
Fig. 1.
Basic synaptic transmission properties of the Mover KO. (A) Sample traces of spontaneous synaptic transmission. (B–G) Properties of spontaneous synaptic activity. Each dot represents one synapse. (H) Sample traces of evoked EPSCs for WT and KO synapses. (I–M) Properties of evoked EPSCs. (N) Paired pulse ratios in various ISIs. Asterisks denote a statistically significant difference. The gray and red shades represent the SEM. (Inset) Sample superimposed traces of evoked EPSCs at various ISIs. Each group of traces (WT or KO) belongs to a single cell. Statistics (B–G): Frequency: WT: 3.42 ± 0.62 Hz, n = 8; KO: 2.81 ± 0.26 Hz, n = 12; t(9.516) = 0.92; P = 0.38; amplitude: WT: −30.75 ± 2.18 pA, n = 9; KO: −32.74 ± 1.78 pA, n = 12; t(19) = 0.714; P = 0.484; rise time: WT: 155.09 ± 11.86 μs, n = 9; KO: 166.72 ± 11.58 μs, n = 12; t(19) = −0.689; P = 0.499; half width: WT: 524.7 ± 19.91 μs, n = 9; KO: 587.15 ± 33.91 μs, n = 12; t(17.098) = −1.588; P = 0.131; τ fast: WT: 356.44 ± 14.09 μs, n = 9; KO: 392.38 ± 24.6 μs, n = 12; t(16.897) = −1.267; P = 0.222; τ slow: WT: 2.61 ± 0.32 ms, n = 9; KO: 2.64 ± 0.26 ms, n = 12; t(19) = −0.076; P = 0.94.

