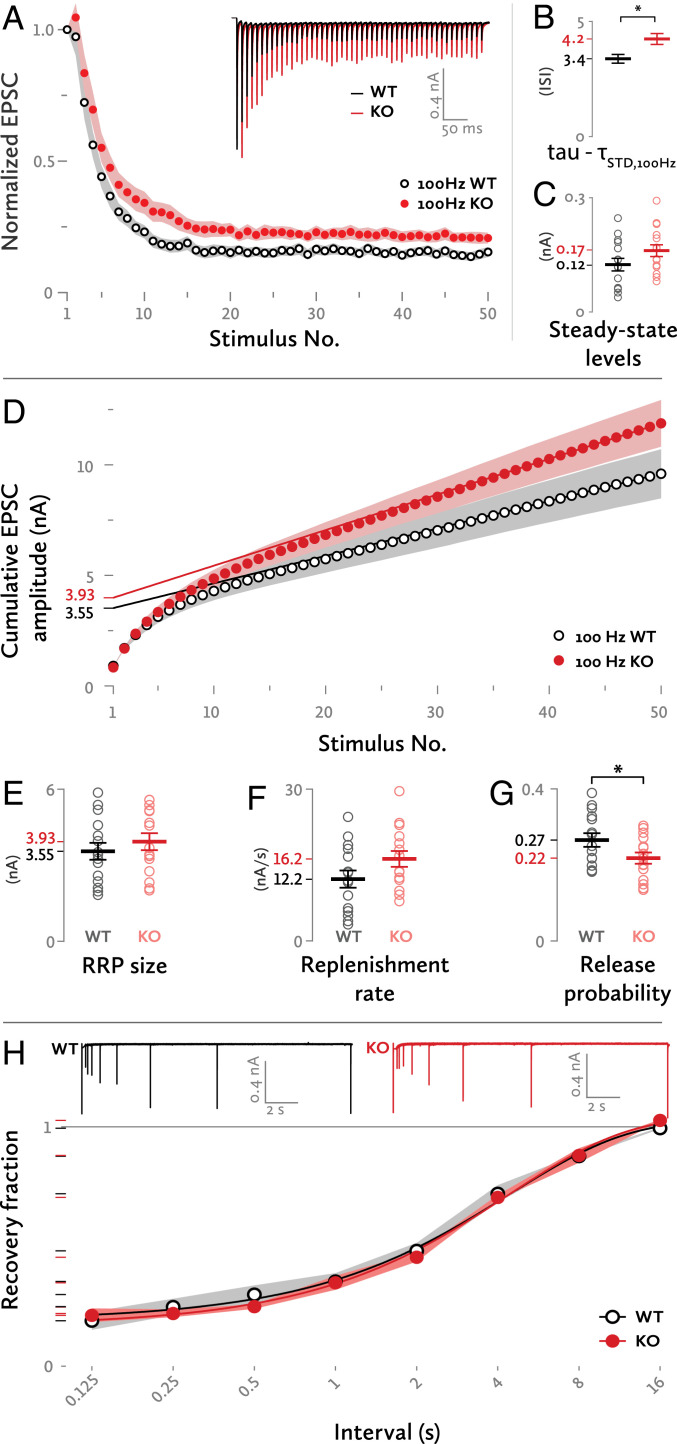
Fig. 2.
Short term plasticity. (A) Normalized EPSC amplitudes during a 100-Hz stimulation train. A monoexponential curve had a relatively better fit for the WT synapses [extra sum-of-squares F test; F = 1.970 (2,718), P = 0.14] whereas the KO synapses were best fit with a double exponential curve [F = 5.972 (2,715), P = 0.0027], indicating an underlying heterogeneity of the priming mechanisms. (Inset) Sample traces of responses to the same stimulation. (B) Time constant of decay (ISI) for the short-term depression (STD) curve of 100 Hz stimulation. The simplest, monoexponential model was chosen to formally compare both groups in the 100-Hz stimulation EPSC amplitude plot. *Difference in Akaike’s corrected Information Criterion = 9.5, comparison between a simpler model where tau is the same for both data sets and a complex model where tau is different for each data set. (C) Steady-state EPSC amplitude levels for a 100-Hz stimulation train. The values of the last 20 EPSCs of each train were taken into account. Each dot represents one synapse. (D) Cumulative plot of EPSC amplitudes during a 100-Hz stimulation train. The regression lines were fit to the last 10 values of each curve and then back-extrapolated to stimulus no. 1. (E) RRP size as determined from the point of intersection between the regression lines and the y axis. (F) Replenishment rate as determined from the slope of the regression lines. (G) The pr of the WT and KO synapses. *P = 0.05, independent-samples t test. (H) Recovery of the EPSC amplitude in various time intervals from a depletion stimulus. (Inset) Sample superimposed traces of evoked EPSCs at various intervals after a depletion stimulus. Each group of traces (WT or KO) was recorded from a single cell. The gray and red shades represent the SEM.

