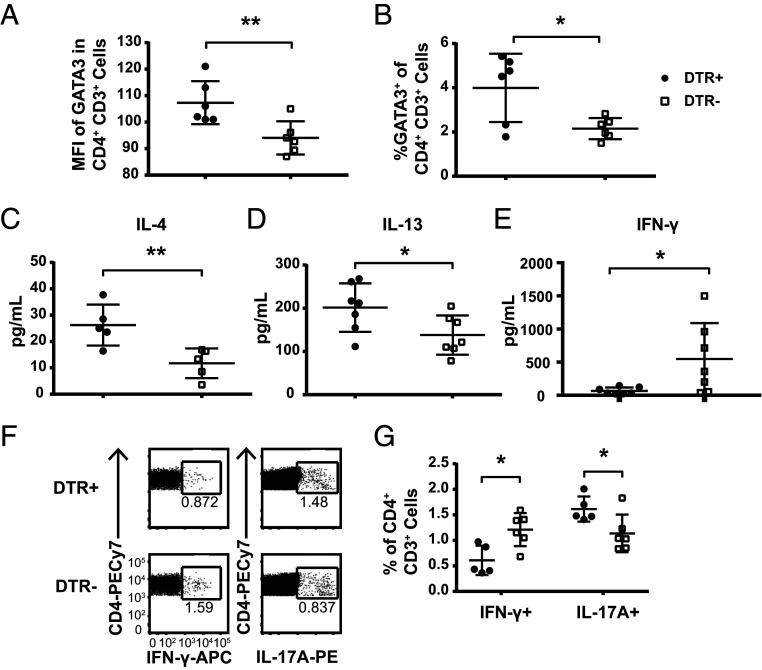
Fig. 2.
DT treatment of CLEC4C-DTR+ mice during FITC CHS increases Th2 polarization and ILC2 in DLN. Cells from the ipsilateral superior cervical lymph nodes were isolated from CLEC4C-DTR+ and littermate control mice 24 h post FITC challenge. (A) Median fluorescence intensity of GATA3 in CD4+CD3+ cells and (B) percentage of GATA3+ of CD4+CD3+ cells. Data show one experiment, representative of two individual experiments (depicted: n = 6 CLEC4C-DTR+, n = 6 DTR– littermates; total: n = 12 CLEC4C-DTR+, n = 12 DTR– littermates). (C–E) Cells from DLN were stimulated with Phorbol 12-myristate 13-acetate (PMA)/ionomycin for 12 h at a concentration of 1 × 10⁶ cells/mL, and supernatants were analyzed for cytokine concentrations by CBA (IFN-γ and IL-4) or ELISA (IL-13). Data in C were pooled from two experiments (n = 5 CLEC4C-DTR+, n = 5 DTR– littermates). Data in D were pooled from two experiments (n = 7 CLEC4C-DTR+, n = 7 DTR– littermates). Data in E were pooled from two experiments (n = 7 CLEC4C-DTR+, n = 7 DTR– littermates). Each data point reflects the mean of two technical replicates from the same sample. Each sample is derived from one mouse. (F) Representative staining of intracellular cytokine staining of CD4+ cells after stimulation with PMA/ionomycin for 6 h with Brefeldin A and Monensin in culture for the final 4 h. (G) Quantification of the percentage of IFN-γ+ or IL-17A+ cells within the CD4+CD3+ population. Data are representative of one of two experiments (depicted: n = 5 CLEC4C-DTR+, n = 6 DTR– littermates; total: n = 10 CLEC4C-DTR+, n = 10 DTR– littermates). *P < 0.05, **P < 0.01; statistics by unpaired two-tailed Student’s t test. Data in A–E and G are mean SD, and each symbol represents an individual mouse.

