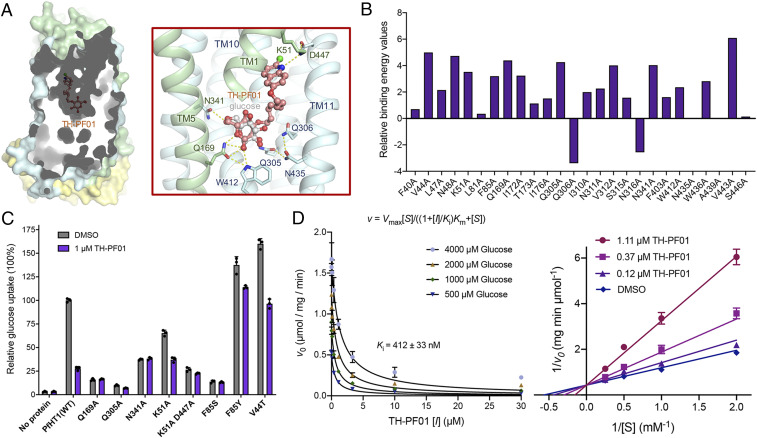
Fig. 4.
Biophysical characterizations of TH-PF01 binding to PfHT1. (A) The identical semitransparent cut-open view of the protein surface is shown for PfHT1 with TH-PF01 docked into the protein. Hydrogen bonds are shown as yellow dashed lines. The amino-terminal, carboxyl-terminal, and intracellular helical domains of PfHT1 are colored in pale green, pale cyan, and yellow, respectively. (B) In silico alanine scanning results. Positive values indicate that the alanine substitution interacts less favorably with TH-PF01 than the native residue. WT: wild type. (C) Key residues involved in TH-PF01 recognition were tested by protein mutagenesis. (D, Left) The curves represent the best fit of data to the competitive inhibition equation, v = Vmax[S]/((1 + [I]/Ki)Km + [S]), where Ki is the apparent inhibition constant of TH-PF01. (D, Right) Lineweaver–Burk plot of experimental kinetic data for inhibition of PfHT1 by TH-PF01, confirming a competitive inhibition mode. All experiments have been repeated three times, and the data are shown as mean ± SD.

