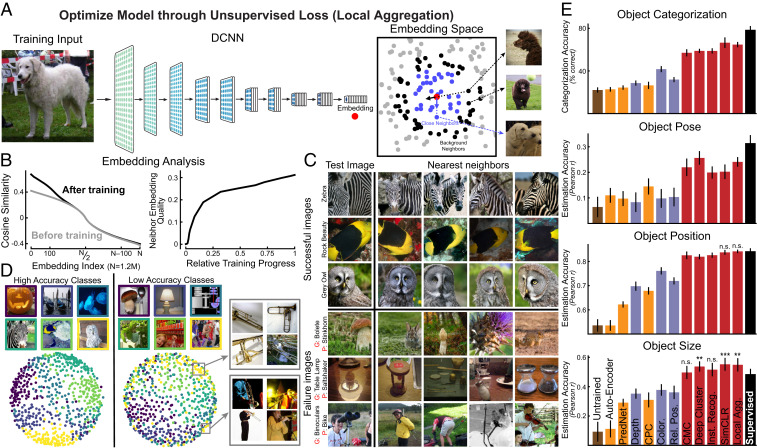
Fig. 1.
Improved representations from unsupervised neural networks based on deep contrastive embeddings. (A) Schematic for one high-performing deep contrastive embedding method, the LA algorithm (41). In LA, all images were embedded into a lower-dimensional space by a DCNN, which was optimized to minimize the distance to close points (blue dots) and to maximize the distance to the “farther” points (black dots) for the current input (red dot). (B) (Left) Change in the embedding distribution before and after training. For each image, cosine similarities to others were computed and ranked; the ranked similarities were then averaged across all images. This metric indicates that the optimization encourages local clustering in the space, without aggregating everything. (Right) Average neighbor-embedding “quality” as training progresses. Neighbor-embedding quality was defined as the fraction of 10 closest neighbors of the same ImageNet class label (not used in training). (C) Top four closest images in the embedding space. Top three rows show the images that were successfully classified using a weighted K-nearest-neighbor (KNN) classifier in the embedding space (K = 100), while Bottom three rows show unsuccessfully classified examples (G means ground truth, P means prediction). Even when uniform distance in the unsupervised embedding does not align with ImageNet class (which itself can be somewhat arbitrary given the complexity of the natural scenes in each image), nearby images in the embedding are nonetheless related in semantically meaningful ways. (D) Visualizations of local aggregation embedding space using the multidimensional scaling (MDS) method. Classes with high validation accuracy are shown at Left and low-accuracy classes are shown at Right. Gray boxes show examples of images from a single class (“trombone”) that have been embedded in two distinct subclusters. (E) Transfer performance of unsupervised networks on four evaluation tasks: object categorization, object pose estimation, object position estimation, and object size estimation. Networks were first trained by unsupervised methods and then assessed on transfer performance with supervised linear readouts from network hidden layers (Materials and Methods). Red bars are contrastive embedding tasks. Blue bars are self-supervised tasks. Orange bars are predictive coding methods and AutoEncoder. Brown bar is the untrained model and black bar is the model supervised on ImageNet category labels. Error bars are standard deviations across three networks with different initializations and four train-validation splits. We used unpaired t tests to measure the statistical significance of the difference between the unsupervised method and the supervised model. Methods without any annotations are significantly worse than the supervised model (), n.s., insignificant difference; **, significantly better results with ; and ***, significantly better results with (SI Appendix, Fig. S2).

