Fig. 1.
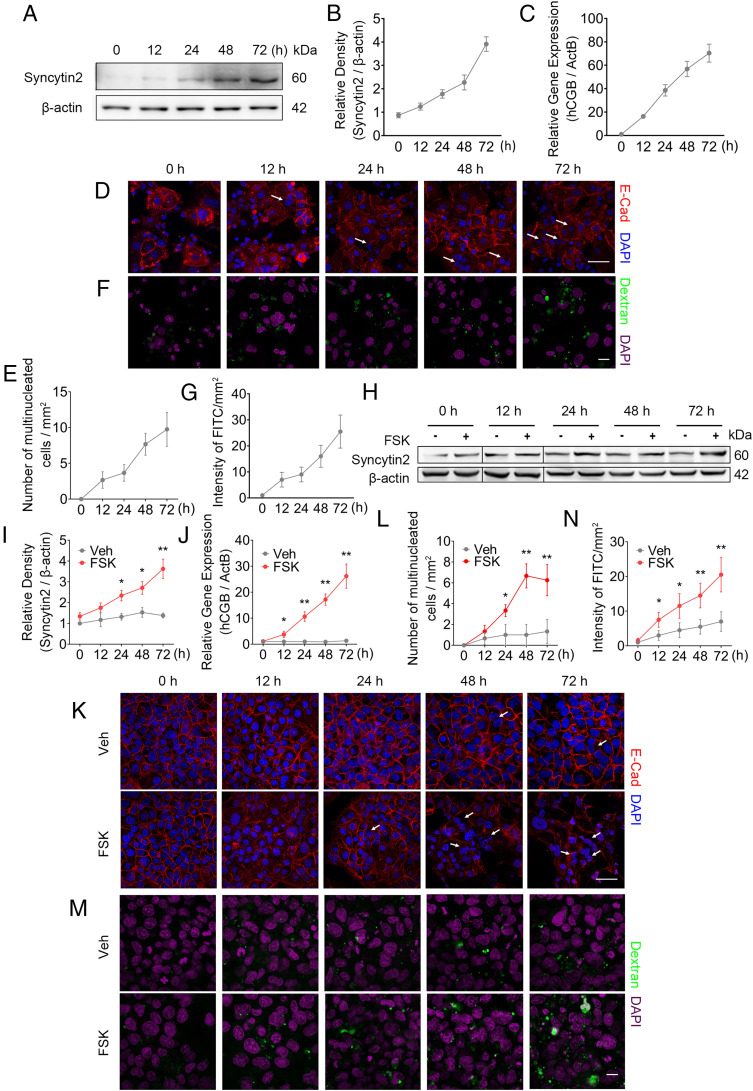
Syncytialization is associated with higher levels of macropinocytosis in human trophoblasts. (A–C) Western blot of Syncytin2 (A and B) and mRNA level of hCGB (C) in term PHT cells. (D and E) Immunostainings of E-cadherin (red) and DAPI (blue) in primary CTBs from normal term placenta, showing spontaneous syncytialization. (D) Representative image of syncytialized trophoblasts. White arrows, multinucleated trophoblasts. (Scale bar, 40 μm.) (E) Quantification of multinucleated cell. E-cadherin staining outlines cell boundary. The number of multinucleated cells was calculated by counting total number of cells with at least two nuclei in five randomly selected fields per sample, three replicates per group. The results are presented as mean ± SD per square millimeter per group. (F and G) Representative FITC-dextran uptake, reflecting macropinocytosis in primary trophoblasts. (F) Representative confocal images showing the intracellular accumulation of fluorescent puncta after 30-min incubation in medium that was supplemented by >70 kDa FITC-dextran. Green and magenta signals indicate FITC-dextran and DAPI, respectively. The macropinocytosis activity was analyzed using ImageJ software (NIH). The “Smooth” feature in ImageJ was employed after background subtraction and before threshold adjustments. The area of FITC-labeled macropinosomes was determined using the “Analyze Particles” feature in ImageJ, and the intensity of FITC of macropinosomes was computed by the mean area of five randomly selected fields per slide, three slides per group (47). (Scale bar, 40 μm.) (G) A time course of FITC intensity reflecting macropinocytosis in trophoblasts. (H–J) Western blot of Syncytin2 (H and I) and mRNA (RT-qPCR) of hCGB (J) in 20 μM FSK exposed BeWo cells. (K) Representative images of 20 μM FSK-induced syncytialization of BeWo cells, with the white arrows indicating multinucleated cells. (Scale bar, 40 μm.) (L) Quantification of multinucleated cell in K. (M) Representative FITC-dextran uptake images, measuring macropinocytosis in FSK exposed BeWo cells. (Scale bar, 40 μm.) (N) Quantification of FITC intensity. The data are shown as mean ± SD, and analysis was carried out by two-tailed t test based at least three independent experiments. *P < 0.05; **P < 0.01.

